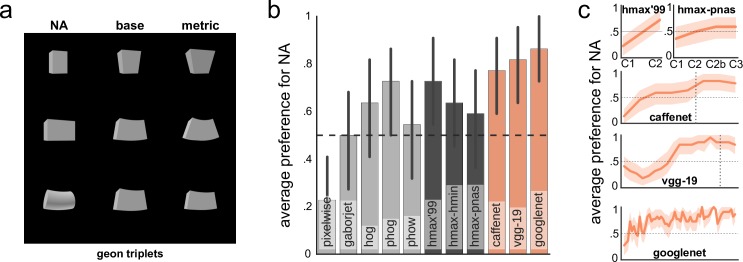
Fig 4.
(a) Examples of geons [24]. In order to measure model’s sensitivity to changes in non-accidental properties, model’s output is computed for a particular stimulus (middle column) and compared to the output when another variant of the same kind of stimulus is presented (right column) and when a non-accidental change in the stimulus is introduced (left column) that is physically (in the metric space) just as far from the base as the metric variant. We used 22 such triplets in total. (b) Model performance on discriminating between stimuli. For each triplet, model’s output is counted as accurate if the non-accidental variant is more dissimilar from the base stimulus than the metric variant is from the base. Chance level (50%) is indicated by a dashed line. (c) HMAX and convnet performance on the task at different layers. Non-accidental stimuli appear to be closer to the base in the early layers, which is consistent with a conservative design of the stimuli [24]. Best performance is observed at the upper layers of convnets with a slight dip at the output layer. Vertical dotted lines indicate where fully-connected layers start. In both plots, error bars (or bands) depict 95% bootstrapped confidence intervals.

