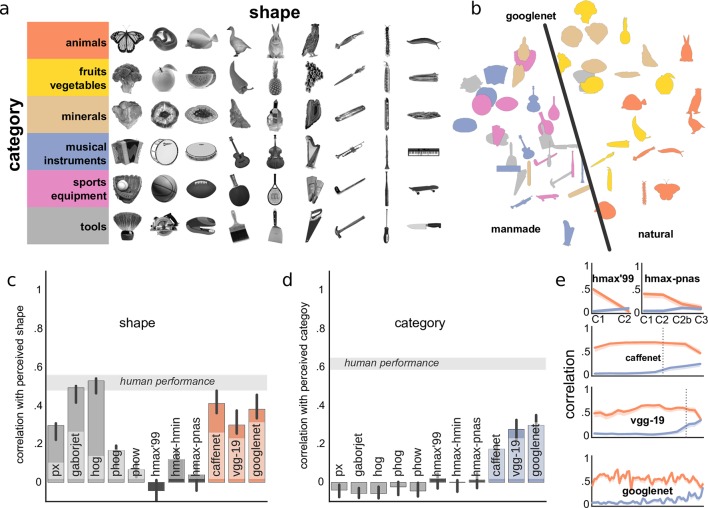
Fig 5. Categorical representations in convnets.
(a) Stimulus set from [37] with shape and category information largely orthogonal. (Adapted with permission from [37].) (b) Multidimensional scaling plot representing object dissimilarity in the output layer of GoogLeNet. The black line indicates a clear separation between natural (brown, orange, yellow) and man-made (blue, gray, pink) objects. (c-d) A correlation between model representations and human shape (c) and category (d) judgments. Gray band indicates estimated ceiling correlation based on human performance. (e) A correlation with human shape (orange) and category (blue) judgments across the layers of HMAX models and convnets. Vertical dotted lines indicate where fully-connected layers start. In all plots error bars (or bands) represent 95% bootstrapped confidence intervals.

