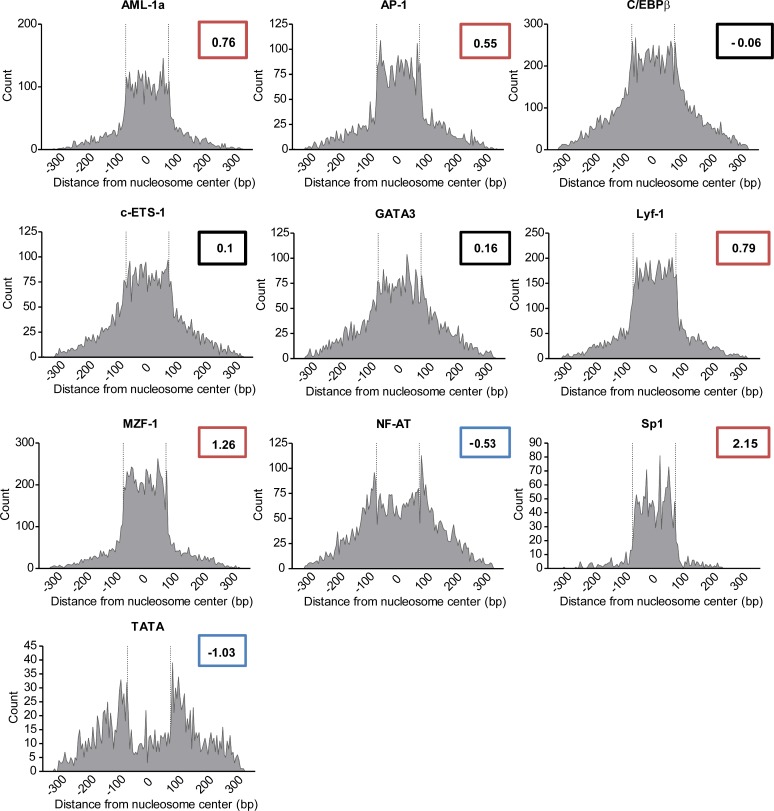
Fig 2. Proximity of transcription factor binding sites to predicted nucleosome centers within the Ly49 gene family.
The C57BL/6 nucleosome map as generated in Fig 1 was compared individually to 17 transcription factors drawn from the TRANSFAC or JASPAR databases, plus TATA as a control. For factors with over 300 putative binding sites in the Ly49 gene family, a histogram is shown displaying each factor binding site’s distance to the nearest nucleosome. Dashed vertical lines indicate the nucleosome boundary. The kurtosis of each histogram is indicated. Histograms with a kurtosis less than -0.5 (blue) are considered to preferentially avoid nucleosome centers; those with kurtosis over 0.5 (red) are preferentially clustered in the center; and those between -0.5 and 0.5 (black) display no preference for nucleosome co-occupancy.

