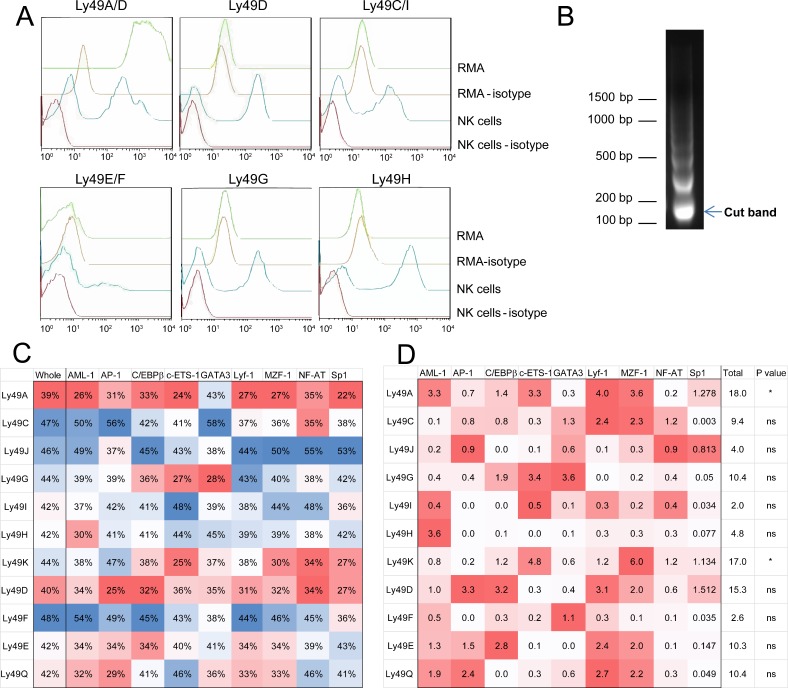
Fig 4. AML-1a shows specific nucleosome depletion in vitro.
MNase-Seq analysis was performed on the Ly49A-expressing C57BL/6 mouse cell line, RMA, to determine the actual nucleosome positions within the Ly49 gene family. (A) Ly49 expression levels on RMA (green) compared to isotype (yellow), and compared to normal NK cells isolated from C57BL/6 splenocytes as a positive (blue) and negative (isotype, red) control. Note that RMA cells are only positive for Ly49A/D, but are negative for Ly49D, indicating the single expression of Ly49A. (B) Following MNase digest, mononucleosomes were isolated from the ~150 bp fragment and sequenced. (C) Nucleosomes from the MNase-Seq results were compared to the predicted nucleosome landscape to determine the degree of true positive nucleosomes at each Ly49 gene (‘Whole’, first column). This determination was repeated for each of the indicated transcription factors. For each column, a heatmap indicates the relative degree of accuracy of the predictions, with blue cells being more accurate and red being less. Regions with very low accuracy are believed to have had a nucleosome remodeling event. (D) A chi-square analysis was performed to assess the degree of specific nucleosome depletion at the indicated transcription factor binding site, taking the overall nucleosome accuracy (‘Whole’, first column of C) as the expected accuracy for that Ly49. Overall significance of the site-specific nucleosome depletion is indicated, and for each Ly49, the factors most contributing to that significance are indicated in red, with color intensity correlating with contribution to the chi-square statistic. A p value < 0.05 was considered significant.

