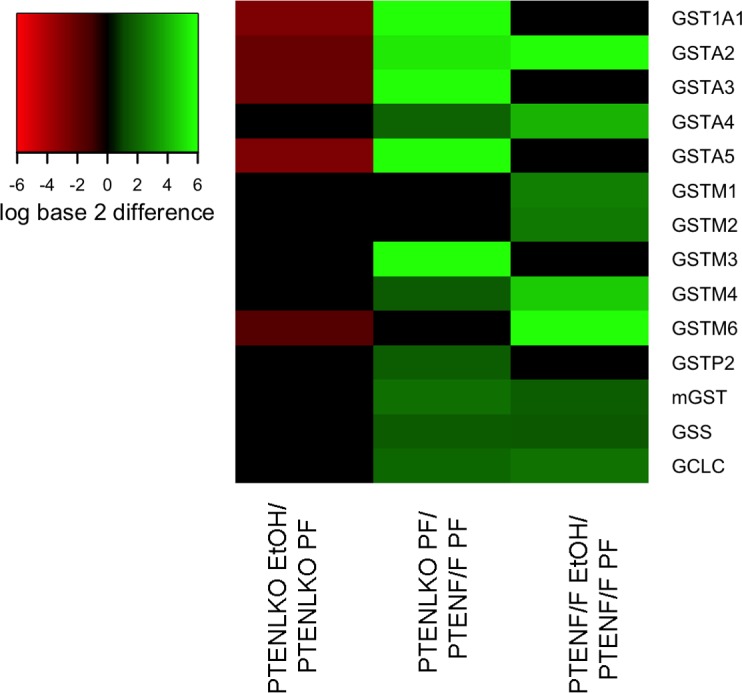
Fig 4. Effects of PTENLKO and EtOH on expression of GSH homeostatic genes.

A limited microarray was performed using pooled tissue isolated from 3 pairs of PF/EtOH fed PTENLKO and PTENf/f respectively. The values represented in the heat map are log base 2 differences in gene expression compared to the respective control. The values are indicated by color with red representing lower expression in the following: PTENLKO EtOH (lane 1), PTENLKO PF (lane 2), PTENf/f EtOH (lane 3), compared to the control: PTENLKO PF (lane 1), PTENf/f PF (lane 2), PTENf/f PF (lane 3) group and with bright green representing higher expression in the treatment groups compared to the controls. Differences in expression that were between -1.5 and 1.5 are represented using the color black.
