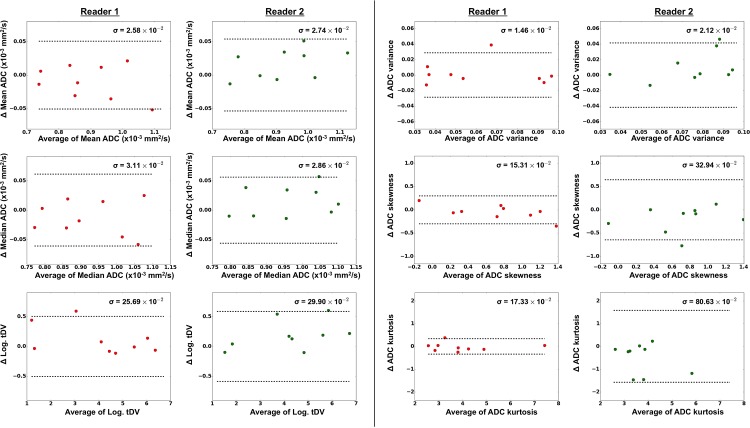
Fig 2. Bland-Altman plots for each parameter of interest, demonstrating the intra-observer repeatability for each of the WBDWI metrics of interest.
Results for Reader 1 are plotted on the left in red and those for Reader 2 on the right in green. In all cases there is little evidence of any correlation between differences in repeat estimates of each parameter (vertical axis) and average value (horizontal axis). Estimates of Intra-observer repeatability, σ, are shown on each plot and 95% repeatability intervals (±1.96σ) are represented as dashed horizontal lines.

