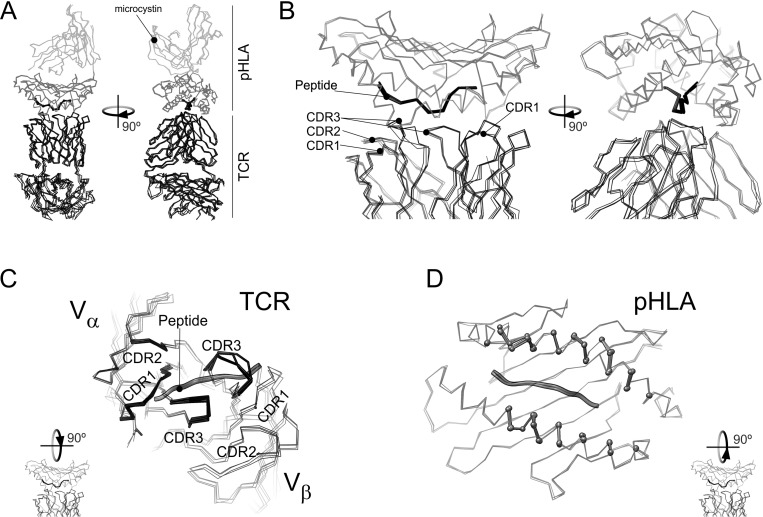
Fig 1. Overlay of the X-ray diffraction models for the WT and mutant TAX-HLA-TCR complexes.
All the panels show an overlay of the Cα atoms of the TAX-HLA-TCR complex (pdb: 1ao7) [15] with those corresponding to V7R (pdb: 1qse) P6A (1qrn) and Y8A (pdb: 1qsf) [22]. A) Overlay of the full complex. TCR molecules are in black lines. Black ball-and-sticks represent the antigenic peptide. The HLA domain containing the peptide is in dark grey lines and the rest of the structure in light grey. B) detail of the ternary complex interface for the structure overlay in (A). C) Apical view of TCR and the antigenic peptide in the above overlay of the four structures. As in (A), TCR atoms are represented by lines, but those from residues closer than 6 Å from HLA are highlighted by stick representation. D) Apical view of HLA and the antigenic peptide for the four structures in the overlay. HLA residues closer than 6 Å from TCR are highlighted in a ball-and-stick representation.

