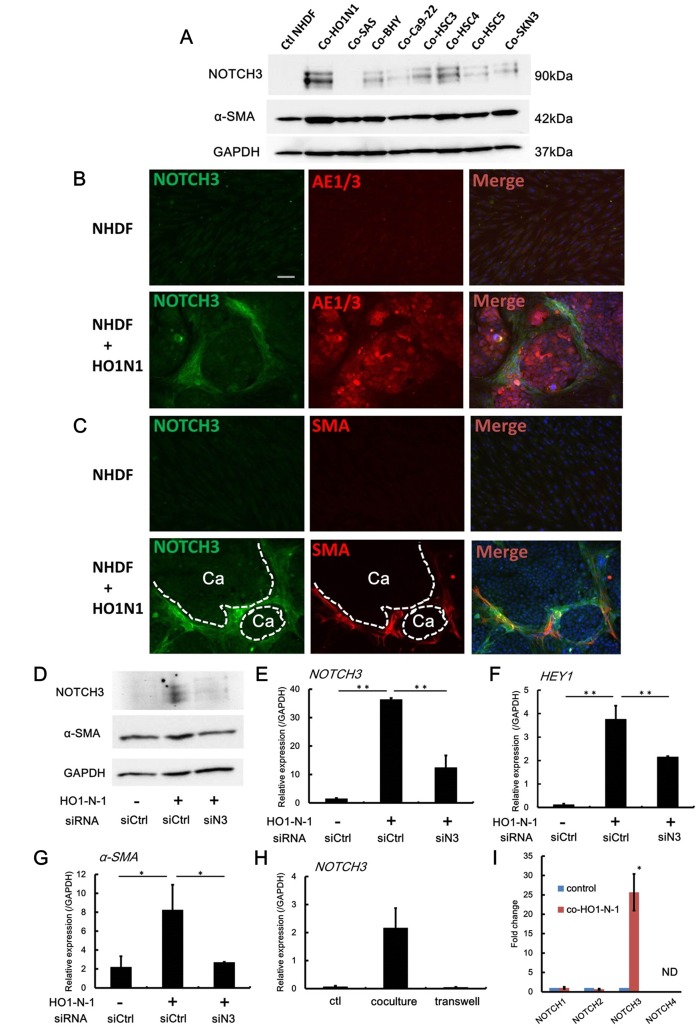
Fig 2. OSCC stimulates NOTCH3 expression in fibroblasts.
A: NHDFs were cultured alone (ctl; control) or cocultured with represented oral and maxillary SCC cell lines. 3 days after coculture, NHDFs were isolated from this coculture by using anti-Fibroblast microbeads for Western blot analysis. B and C: Immunofluorostainig using coculture with HO1-N-1 and NHDFs. Culture of NHDFs alone was used as a control. The bundles of NOTCH3-positive NHDFs (green) were observed around the AE1/AE3-positve HO1-N-1 cancer nests (red) (B). Double NOTCH3 and α-SMA-positive NHDFs were intervened between HO1-N-1 cancer nests. Ca, HO1-N-1 cancer nests. Dotted lines demonstrate the interface of HO1-N-1 cancer nests and NHDFs. (C). Scale bar, 100μm. The nuclei were counterstained by DAPI. D-G: NHDFs transfected with negative control siRNA (siCtrl) or siRNA for NOTCH3 (siN3) was cultured alone or cocultured with HO1-N-1 cells. 3 days after coculture, NHDFs were isolated from this coculture and subjected to western blot (D) and qPCR analyses to measure NOTCH3 (E), HEY1 (F), α-SMA (G). H: NHDFs were cultured alone (control), or directly cocultured with HO1-N-1 cells, or cocultured with transwell-separated HO1-N-1 cells. 3 days after culture, NHDFs were isolated and subjected to qPCR analysis. I: qPCR to measure each NOTCH mRNA expression in NHDFs isolated from coculture with HO1-N-1 cells. ND, not detected. *P < 0.05, **P < 0.01.

