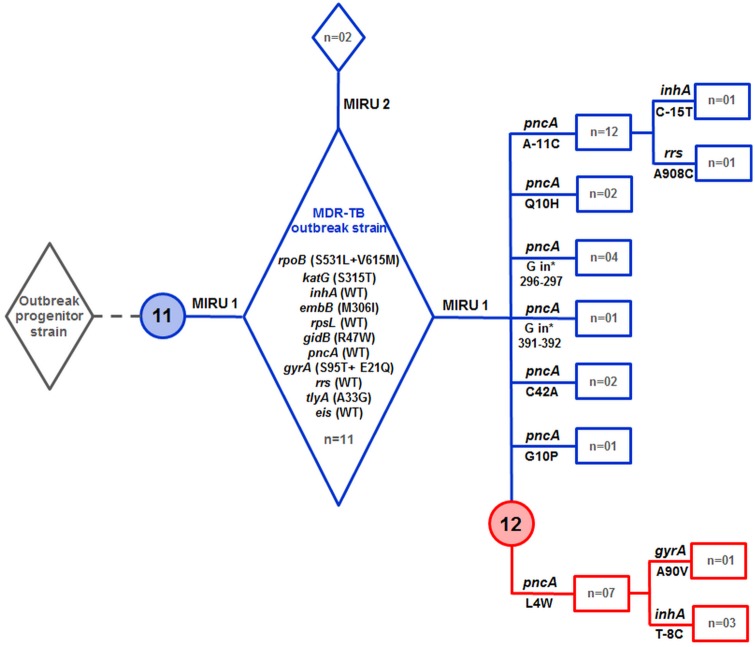
Fig 4. Emergence and expansion scenario of the Tunisian Haarlem3 MDR-TB outbreak based on genotypic analyses and accumulation of mutations in drug resistance genes.
Numbers 11 and 12 within the blue and red circles indicate the 11-banded and 12-banded RFLP profiles, respectively. Lanes in blue indicate outbreak strains that evolved as 11-banded IS6110 RFLP profile, while lanes in red indicate those with the 12-banded IS6110 RFLP profile. The number of strains (n =) with a particular genotypic and drug resistance mutation profile is indicated. The detailed MIRU-VNTR24 patterns of the outbreak strains (MIRU1 and MIRU2) are shown in S1 Table.

