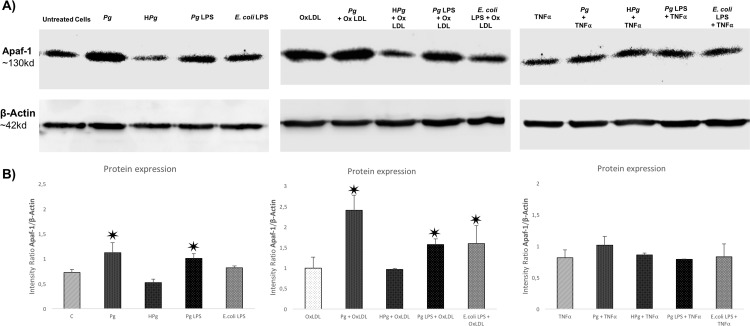
Fig 8. Differential modulation of Apaf-1 protein expression after infection with Pg and its LPS in Ox-LDL and TNF-α pre-treated cells.
(A) Western blot analysis for Apaf-1 protein in HUVECs infected with Pg at a MOI of 100 or with HPg and stimulated by Pg-LPS (1μg/ml) or E.Coli-LPS (1μg/ml) and pre-treated with Ox-LDL (50μg/ml) or TNF- α (10ng/ml) at 24h. (B) Density tracing was used to illustrate the quantitative differences in western blot analysis for Apaf-1 protein. Data were expressed as mean ± SD. *: difference between non-stimulated/infected and stimulated/infected cells, p < 0.05.

