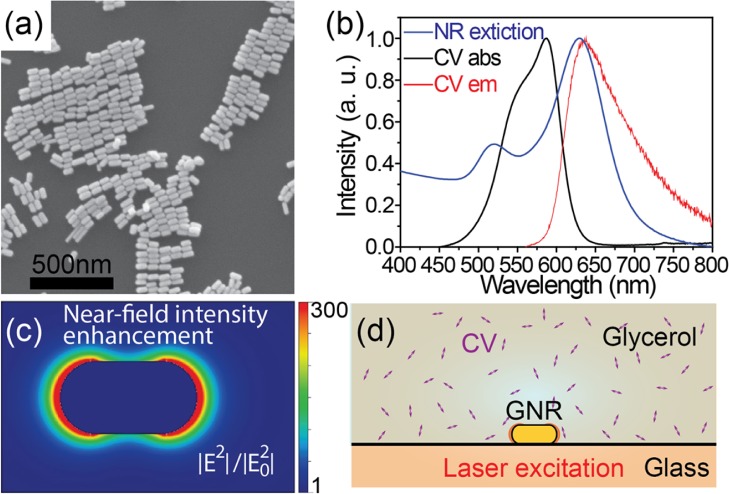
Figure 1.
(a) SEM image of the synthesized gold nanorods. (b) Extinction spectrum (normalized) of a gold nanorod suspension in water (blue) and absorption (black) and emission (red) spectra of crystal violet in glycerol. (c) Calculated near-field optical intensity distribution around a single nanorod. The color bar represents the near-field intensity enhancement factors. (d) Schematic view of the experimental configuration. Double-ended arrows represent CV molecules in glycerol.

