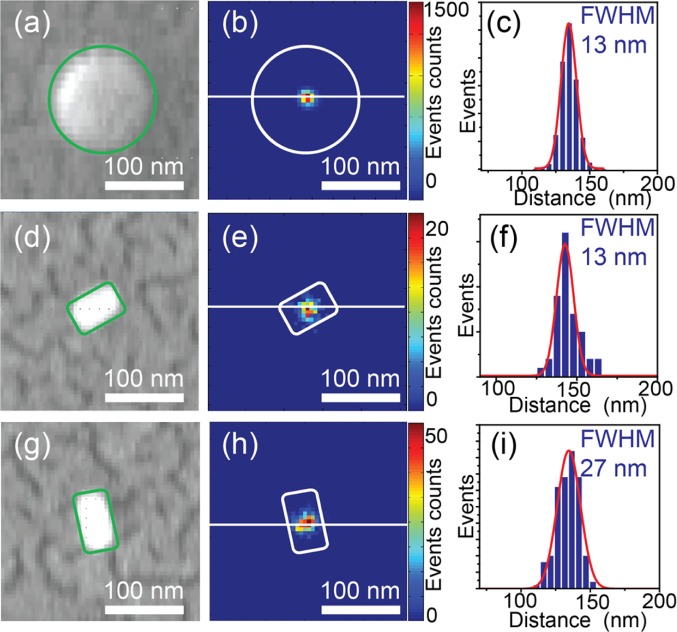
Figure 3.
(a) SEM image of a fluorescent bead. The green circle highlights the outline of the bead. (b) Reconstructed super-resolution localization image of the same fluorescent bead. The white circle outlines the shape of the bead. The color bar represents the counts of events in each bin. (c) Profile of localization event distribution along the white solid line in (b). (d and g) SEM images of individual nanorods. (e and h) Localization images of the rods in (d) and (g), respectively. The color bars represent the counts of events in each bin. (f and i) Localization event distributions along the white solid lines in (e) and (h), respectively. The white and green blocks highlight the outline of the nanorods. The red solid lines are fitted Gaussian profiles.

