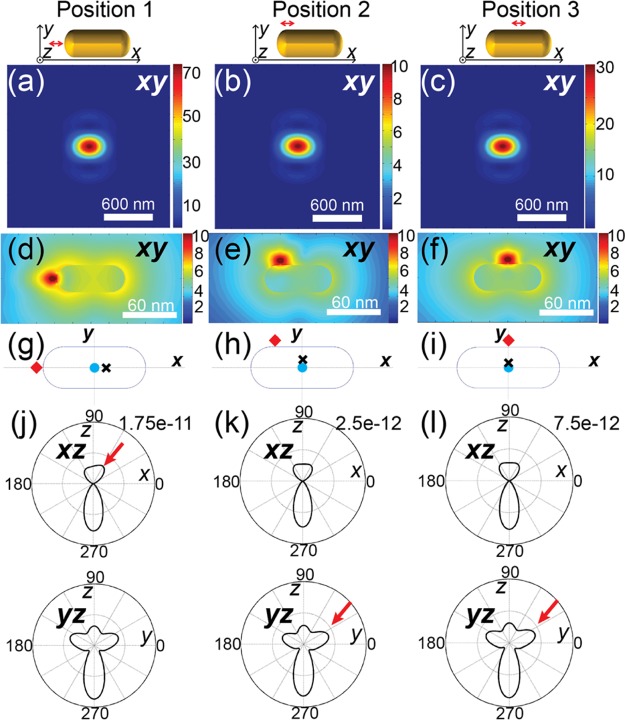
Figure 4.
(a–c) Calculated PSFs for different dye positions in regard to the nanorod, illustrated in the drawings on top of each plot. (d–f) Near-field distributions of molecular emission around the nanorod at three different dye positions. (g–i) Localization results using a 2D Gaussian PSF approximation on the three circumstances shown in (a), (b), and (c), respectively. Red diamonds, black crosses, and cyan dots are used to represent the actual position of the fluorophore, the localized events using 2D Gaussian, and the center position of the nanorod, respectively. (j–l) Emission angular distributions in the xz and yz plane from the molecule–antenna hybrids with different configurations in (a)–(c), respectively. The red arrows highlight the asymmetric distribution that leads to the off-center localization.

