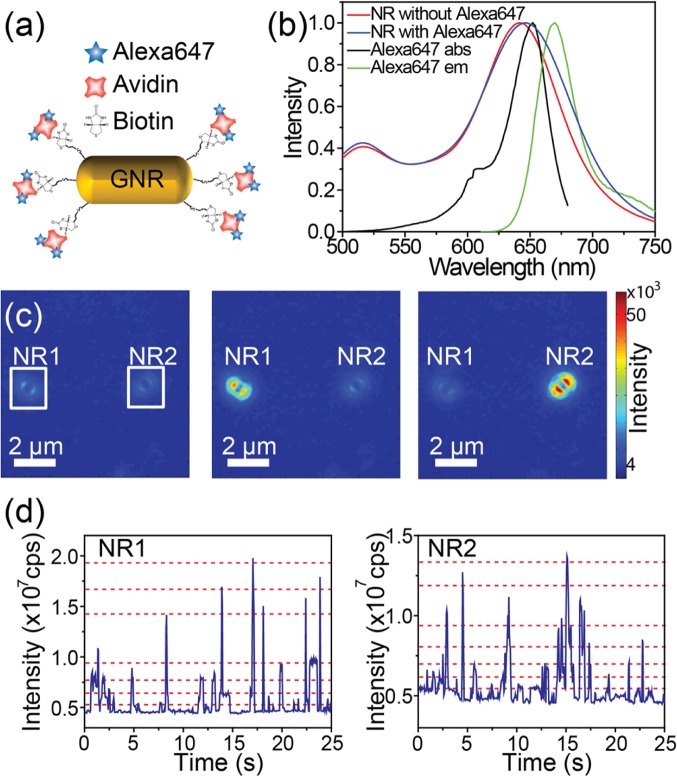
Figure 5.
(a) Schematic view of a gold nanorod labeled with Alexa647. (b) Extinction spectra of gold nanorods before and after label attachment (red and blue, respectively) and the absorption spectrum (black) and the emission spectrum (green) of Alexa647. (c) Snapshots of two defocused patterns at different times. The two nanorods show random blinking events. (d) Fluorescence intensity time traces of the nanorods highlighted with white squares in (c). The stochastic blinking of each fluorophore on the nanorods leads to discrete intensity levels in the fluorescence time trajectories, from which we can estimate the number of fluorophores on each nanorod. The red dashed lines are a guide to the eye to indicate the aforementioned intensity levels.

