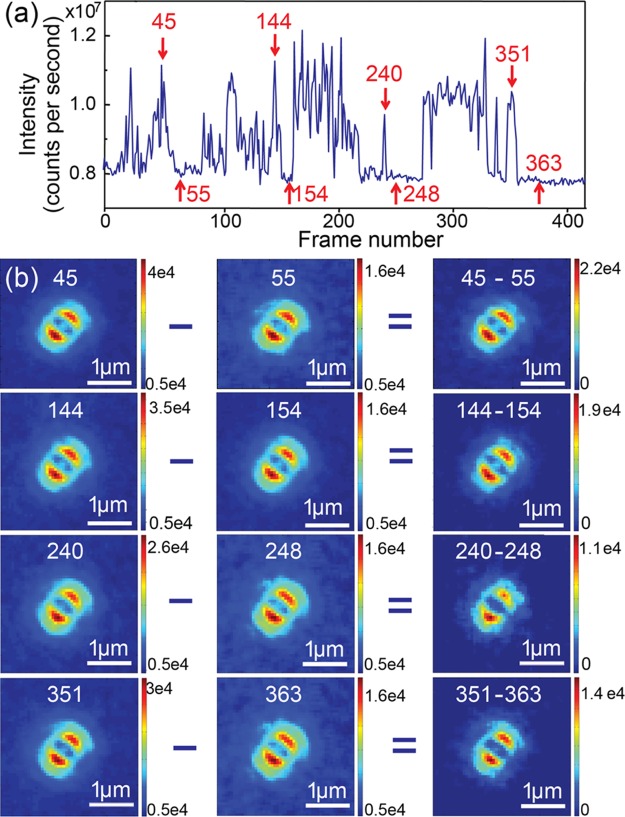
Figure 6.
(a) Fluorescence intensity time trace of a single nanorod labeled with Alexa647 in the switching buffer. The red arrows and the associated numbers indicate the frame numbers of selected images. (b) Set of defocused patterns obtained from fluorescence bursts and from background in the frames highlighted in (a). Patterns in the right column are obtained by subtracting the patterns in the middle column (nanorod photoluminescence patterns) from the patterns in the left column (patterns of total intensities). The corresponding frame numbers are given on top of each defocused pattern. The color bars represent fluorescence intensities.

