
Figure 1.
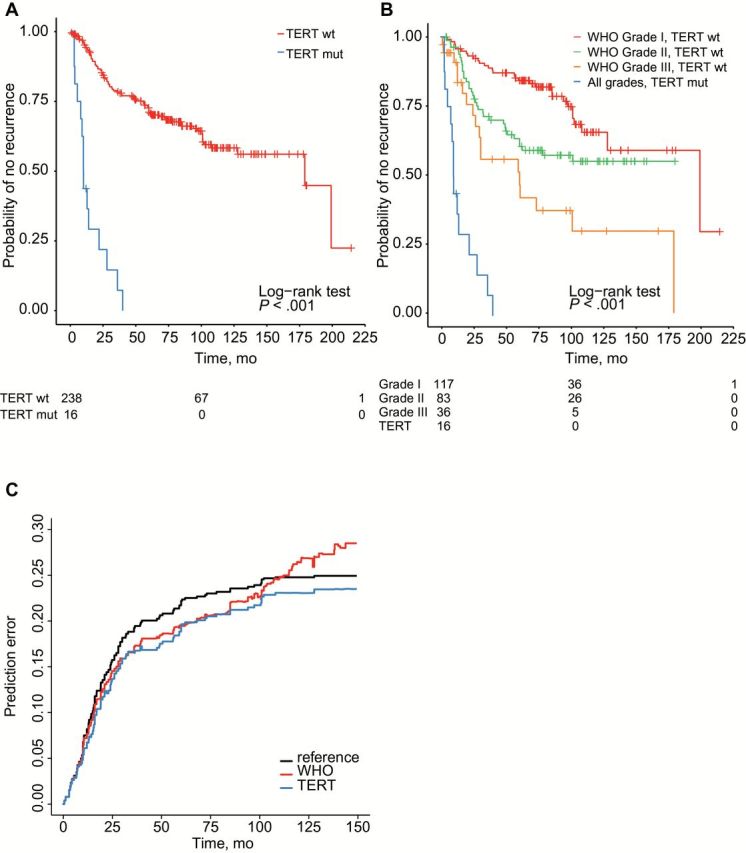
Kaplan-Meier plots of time to progression in TERT promoter mutant vs wild-type samples (A) and World Health Organization (WHO) grade I-III vs TERT mutant (B). Tables below plots indicate patients at risk at time points 0, 100, and 225 months. All statistical tests were two-sided Brier prediction plot of WHO grading vs TERT status. The reference group is the marginal Kaplan-Meier prediction model (C). mut = mutant; WHO = World Health Organization; wt = wild-type.