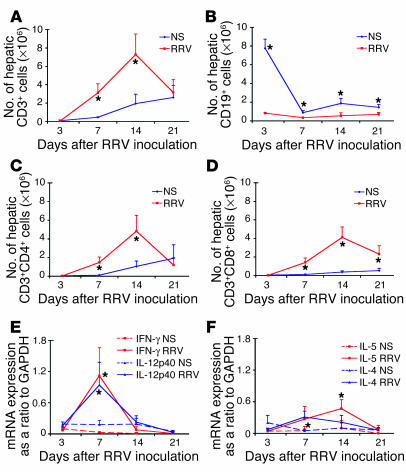
Figure 3.
RRV infection results in Th1 polarization of hepatic lymphocytes. Hepatic cell surface staining by flow cytometry for CD3 (A) and CD19 (B) shows that the lymphocytic infiltrate in portal tracts is predominantly composed of CD3+ cells beginning 7 days after RRV inoculation. CD3+ cells also showed staining with CD4+ (C) or CD8+ (D). (E) Functional polarization of T lymphocytes is demonstrated 7 days after RRV challenge by an increase in mRNA expression for IFN-γ and IL-12p40. (F) The mRNA expression for Th2 cytokines also increases above the levels of controls at 7 and 14 days, but at lower levels when compared with Th1 cytokines. *P < 0.05 when the RRV group is compared with controls; n = 4–7 mice per group at each time point. NS, normal saline.

