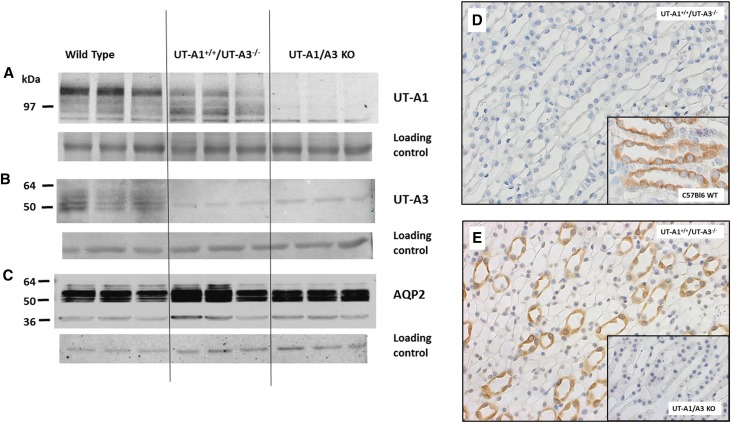
Figure 2.
The UT-A1+/+/UT-A3−/− mice express UT-A1 and lack UT-A3. (A, B) Western blot of WT (left), UT-A1+/+/UT-A3−/− (center), and UT-A1/UT-A3 knockout ([KO] right) mice probed with the C-terminal UT-A1 antibody (panel A identifies UT-A1) or MQ2 antibody (panel B identifies UT-A3). (C) AQP2 in the same samples. Each blot was also stained with Ponceau S for general protein content as a loading control, shown immediately below each Western blot. (D and E) Immunohistochemical verification of the urea transporter protein expression in the UT-A1+/+/UT-A3−/− mice. (D) Lack of staining of UT-A3 in the UT-A1+/+/UT-A3−/− mice. The positive control staining of UT-A3 in the WT mice is provided in the inset micrograph. (E) Positive staining of UT-A1 (brown) in the inner medulla of the UT-A1+/+/UT-A3−/− mice. The negative staining of the knockout mice is provided in the inset picture. Images were acquired at 400× using an Olympus inverted microscope fitted with a 40× objective.

