Figure 3.
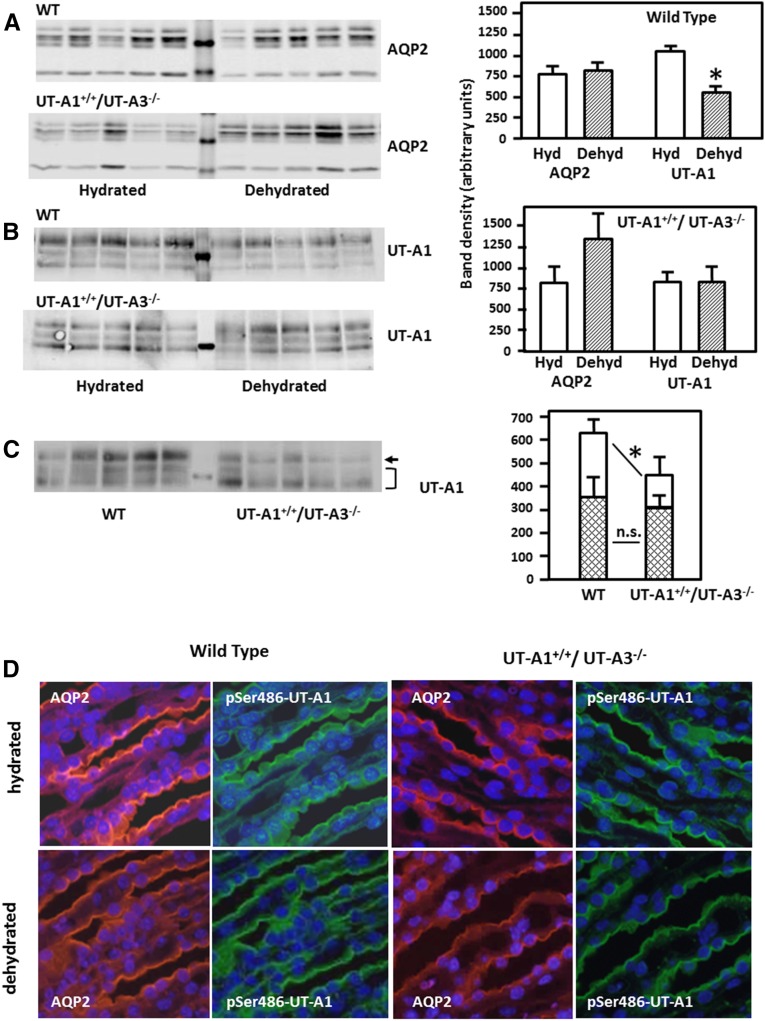
UT-A1 levels in UT-A1+/+/UT-A3−/− and WT mice are comparable and unchanged with dehydration. WT and UT-A1+/+/UT-A3−/− mice were dehydrated for 24 hours, then kidneys from hydrated (Hyd) and dehydrated (Dehyd) mice were collected and dissected. Inner medullas were analyzed for AQP2 and UT-A1 content. Shown are representative Western blots and summary densitometries in bar graphs. (A) AQP2 in WT and UT-A1+/+/UT-A3−/− mouse inner medullas from normal and dehydrated mice (n=6/condition per group). (B) UT-A1 in the same mice. Representative Western blots are shown with average band densities provided in the bar graph; *P<0.05. (C) Western blot comparing levels of the 117- and 97-kDa glycoforms of UT-A1 in WT and UT-A1+/+/UT-A3−/− mice. Bar graphs show average band densities (±SEM), n=8 WT and 9 UT-A1+/+/UT-A3−/− mice. *P<0.05 for the 117-kDa band. The differences in density were not statistically significant (NS) for the 97-kDa band or for total UT-A1 abundance (not shown in figure). (D) Immunofluorescence staining of AQP2 (left micrographs, red) and p486-UT-A1 (right micrographs, green) in kidney slices from WT and UT-A1+/+/UT-A3−/− mice under normal hydrated and 24-hour dehydrated conditions. Slides were double-stained and images were collected using wavelength-specific filters. Nuclei were costained with 4',6-diamidino-2-phenylindole. Imaged with a 40× objective as described in Concise Methods.

