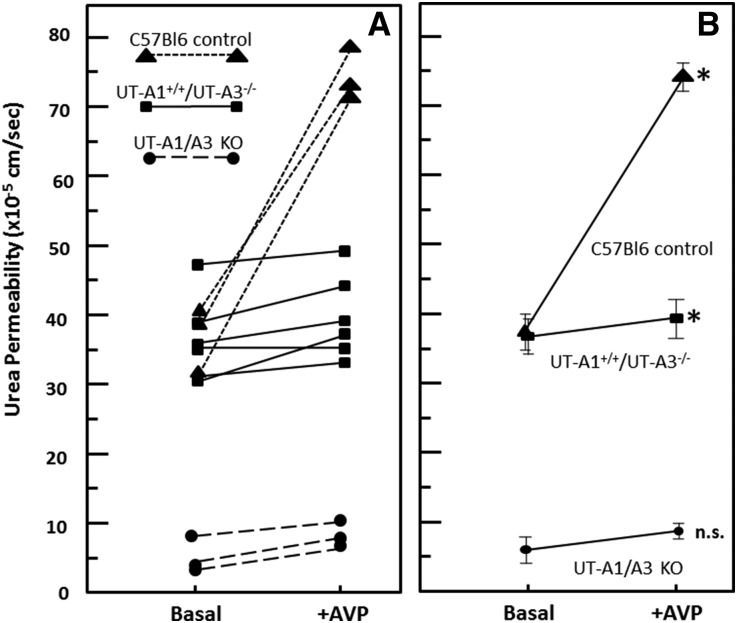
Figure 4.
UT-A1 alone supports basal but not vasopressin (AVP)-stimulated urea permeability. Shown is the urea permeability in isolated perfused tubules from WT (triangles), UT-A1+/+/UT-A3−/− (squares), and UT-A1/A3 knockout ([KO] circles) mice. (A) Each line represents the permeability results from a single animal. Control n=3; UT-A1+/+/UT-A3−/− n=6, and UT-A1/A3 KO n=3. Urea permeability was measured at basal levels, then 1×10⁻¹⁰ M AVP was added to the bath for 15 minutes and urea permeability was again measured. (B) Mean urea permeability (±SEM) in each genotype at basal and AVP-stimulated conditions. *P<0.05 by paired t test.

