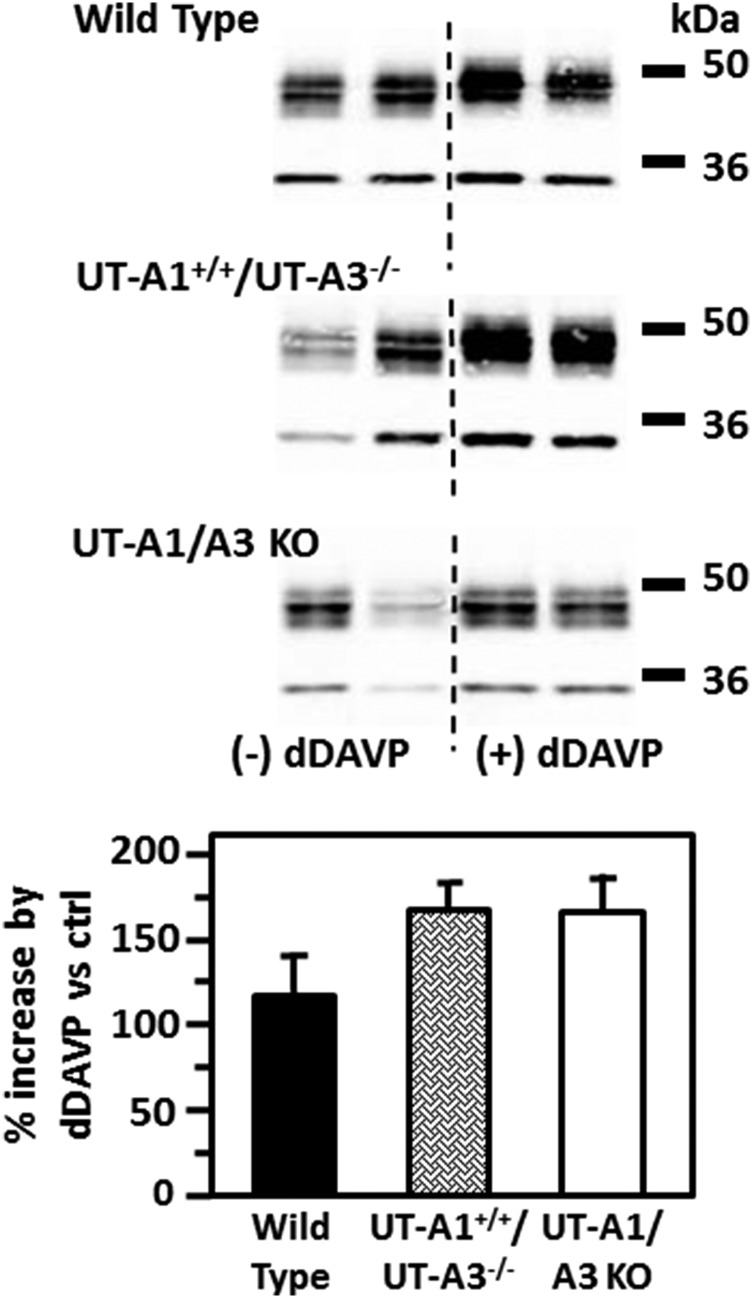
Figure 6.
AQP2 response to dDAVP is unaffected by the lack of UT-A3. (A) The representative Western blots show AQP2 in the inner medullas of WT (top), UT-A1+/+/UT-A3−/− (middle), or UT-A1/UT-A3 knockout ([KO] bottom) mice under basal (left lanes) and after 4 days of dDAVP injections (right lanes). The bar graphs show the percent increase in AQP2 protein levels resulting from dDAVP treatment. Data: mean±SEM, n=8.

