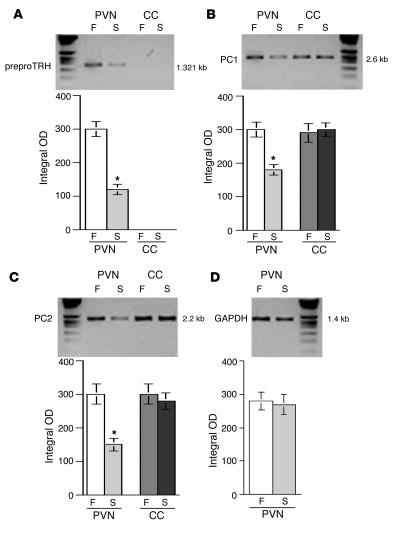
Figure 3.
Analysis of fasting- and leptin-induced regulation of PC1 and PC2 mRNA in the PVN and ME of rats. (A–D) A typical quantitative 32P-RT-PCR for TRH, PC1, and PC2 using a limiting number of PCR cycles (see Methods) in PVN and CC tissues derived from fed (F) and starved (S) animals. Integrated optical density using NIH Image software for PC1, PC2, and TRH in the 2 brain areas was analyzed. ANOVA was followed by a multiple comparison using a Tukey-Kramer test. *P < 0.01, significant difference at this level. GAPDH mRNA was analyzed as an endogenous control.

