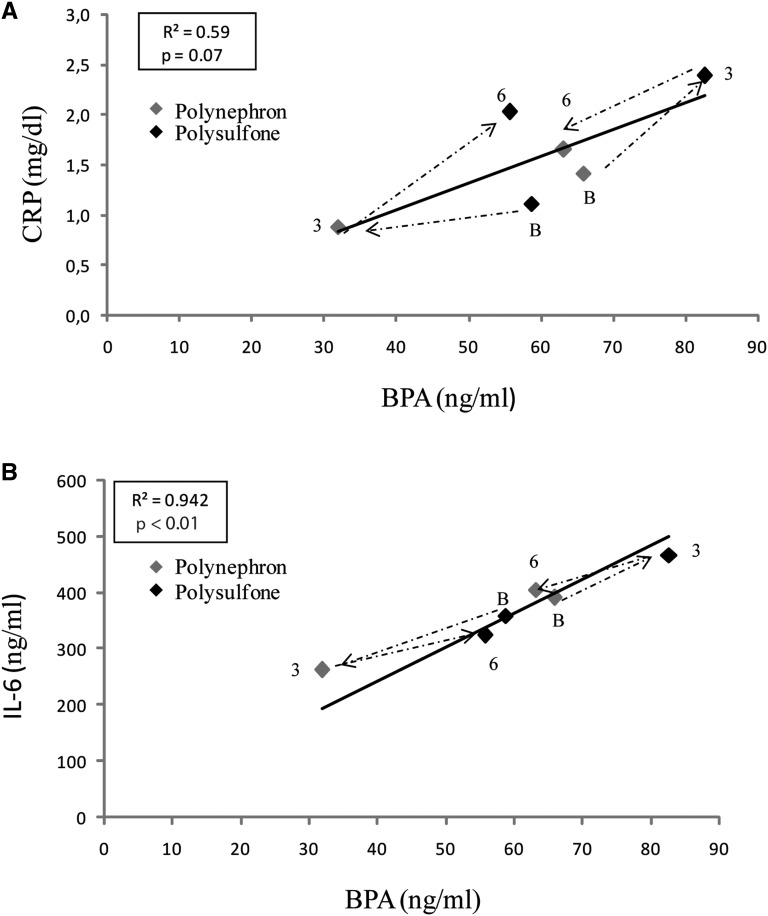
Figure 7.
Correlation between serum BPA levels and inflammatory markers. Mean values for each group and time point are shown. BPA and inflammatory markers (A) CRP and (B) IL-6 were assessed in the same samples. Dashed lines represent timelines for the two independent groups. The first data point (B) along the dashed line represents baseline values, the second (3) the 3-month time point, and the third (6) the 6-month time point. Arrows represent the sequence of dialyzers. The dialyzer is color-coded. This was a crossover study of prevalent patients on hemodialysis and each independent study group was dialyzed at baseline with a different dialyzer. Thus, one group changed from polysulfone at baseline to polynephron and back to polysulfone, and the other group changed from polynephron at baseline to polysulfone and back to polynephron.

