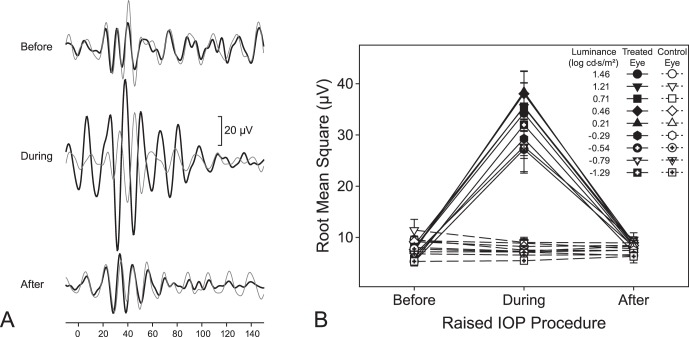
Figure 4.
(A) Sample OPs (isolated via a 100–300 Hz bandpass filter) from a treated (thick black lines) and its control (thin gray line) eye before, during, and following 35 mm Hg IOP elevation of the treated eye at a luminance of 2.88 log cd·s/m2. (B) Mean RMS values ± SE for OPs before, during, and following 35 mm Hg IOP elevation of the treated (filled symbols) and control (empty symbols) eyes. Please refer to text for comparisons.

