Figure 6.
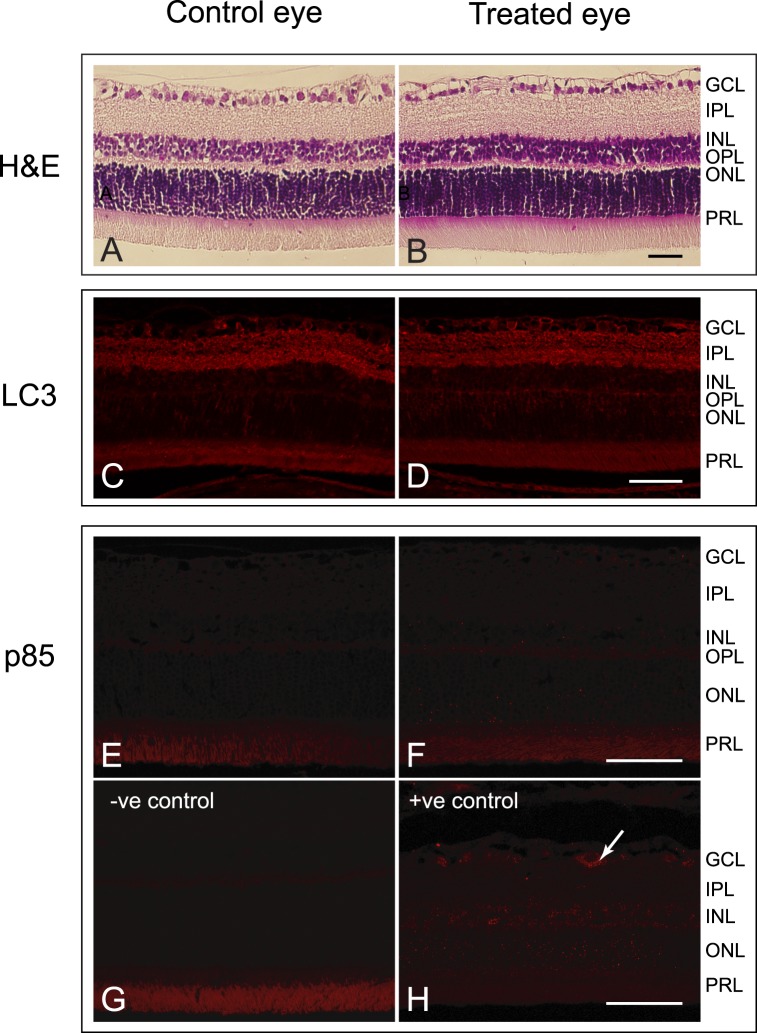
Histologic cross-sectional images of the retina from (A) a control and (B) a treated eye. No gross differences in the retinas were observed. Scale bars: 50 μm. Micrographs of retinas from (C) a control and (D) a treated eye labeled for LC3A/B. LC3A/B was detected in the GCL, IPL, and OPL. No differences in the labeling were detected. Autofluorescence was present within the photoreceptor layer (PRL) as demonstrated by the primary antibody negative control (not shown). Scale bar: 50 μm. Micrographs of retinas from (E) a control and (F) a treated eye labelled for PARP p85 fragment. Only autofluorescence was detected within the PRL, as demonstrated by the primary antibody negative control (G). A positive control from a 6-week intermittently elevated IOP glaucomatous rat (unpublished data from Joos et al.18) shows the PARP p85 fragment in the cytoplasm of a cell in the RGC layer (arrow) (H). Scale bar: 50 μm.

