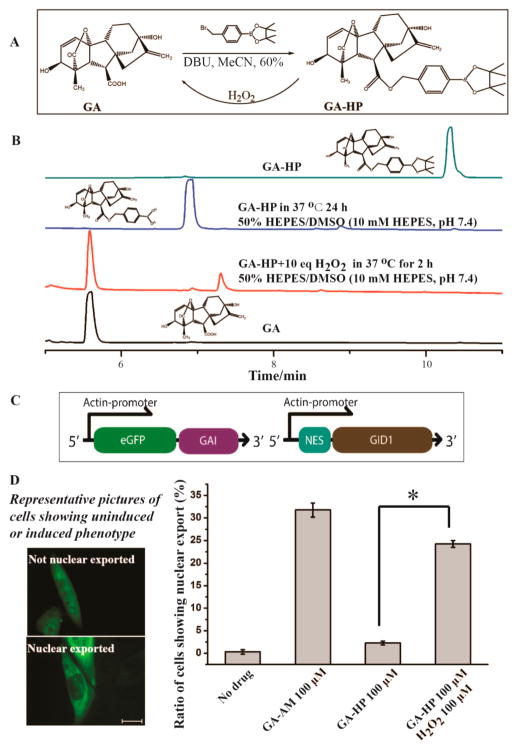
Figure 3.
(A) Synthesis of GA-HP and its conversion to GA in the presence of H2O2. (B) GA-HP (5 mM) was treated with or without 50 mM of H2O2 for indicated time periods. (C) DNA constructs for EGFP nuclear export and (D) the nuclear export of EGFP in CHO cells under different treating conditions (30 min). The statistical data was obtained by counting cells to give the percentage of cells showing nuclear export over the total EGFP positive cells. Cells were counted from three separate experiments each with five different areas chosen randomly, and over 700 cells were counted for each sample. Scale bar is 20 μm (D). Error bars are SD (N = 3). *P-value < 0.001.

