Figure 3.
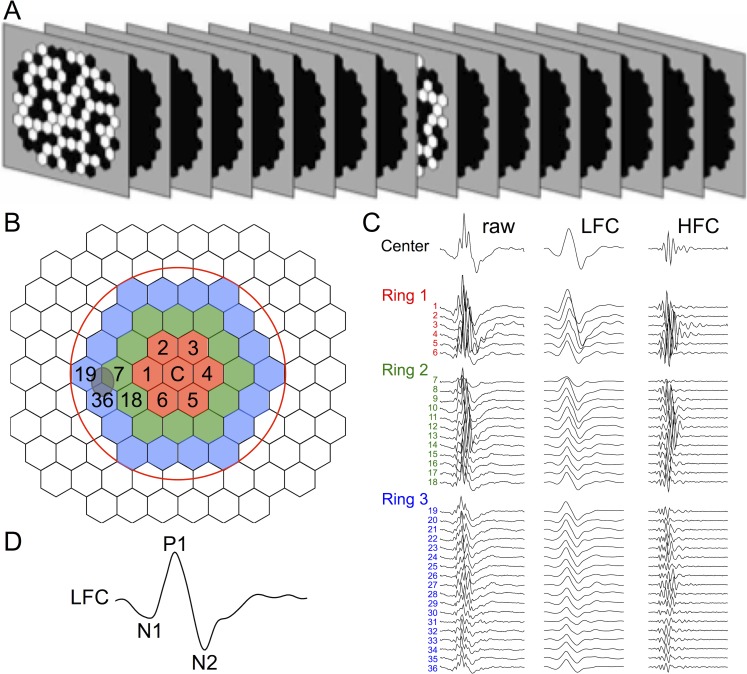
Multifocal ERG methods. (A) Schematic of slow-sequence mfERG stimulus with seven blank frames between each m-sequence step. Stimulus pattern was 103 hexagons over approximately 55°; mean luminance of m-steps: 100 cd/m2; contrast: approximately 99%; m-sequence exponent: 12; 8-minute recordings × 2 per session. In this study we analyzed the 37 responses from the area enclosed by the red circle in (B); which are shown for a healthy eye in (C) color-coded by rings around the central element and numbered by location. For each of the three rings, the responses are arranged down the column beginning with the response from the temporal field closest to the position of the “blind spot” (itself approximated by the gray oval overlapping elements 7, 19, 36), continuing around the ring through the superior field, nasal field, and inferior field. Each of the 37 central responses was filtered at 75 Hz into a LFC and HFC, as shown in panel C by the second and third column of traces, respectively. (D) The LFC features N1, P1, and N2 are labeled on the filtered response from the central element.

