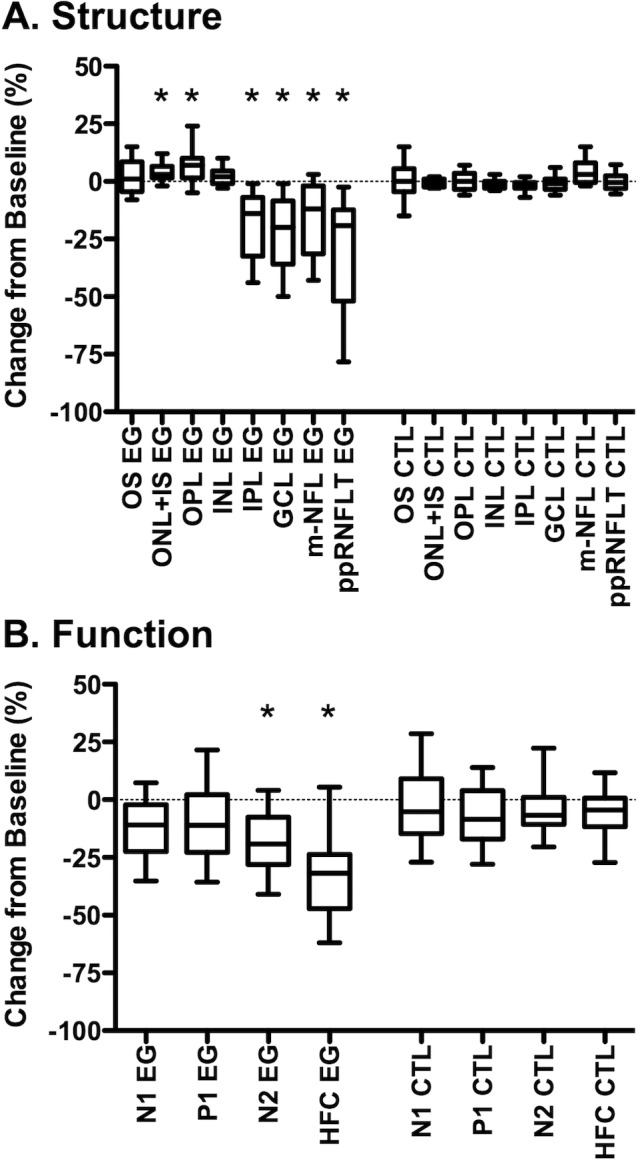
Figure 4.

Longitudinal changes in macular structure (A) and function (B). Box plots represent the distribution (median, interquartile range, extremes) of longitudinal change at the final session for each macular layer thickness (A) and mfERG parameter (B) in EG and fellow control eyes (CTL). Change is expressed as the difference from the average baseline value in the same eye: ([final value − baseline value]/baseline value) *P < 0.001. Peripapillary RNFL thickness is abbreviated as ppRNFLT.
