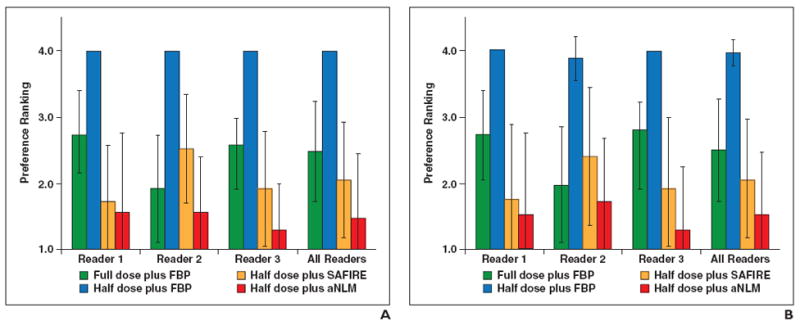
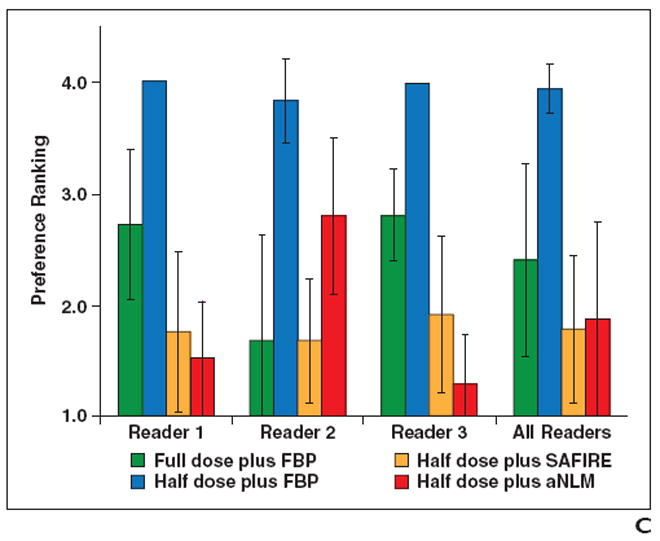
Fig. 2.


Preference ranking scores for liver, kidney, and small bowel.
A–C, Graphs show preference ranking scores for four configurations used in CT examinations of liver (A), kidney (B), and small bowel (C). FBP = filtered back-projection, SAFIRE = sinogram-affirmed iterative reconstruction (Siemens Healthcare), aNLM = adaptive nonlocal means.
A–C, Graphs show preference ranking scores for four configurations used in CT examinations of liver (A), kidney (B), and small bowel (C) FBP = filtered back-projection, SAFIRE = sinogram-affirmed iterative reconstruction (Siemens Healthcare), aNLM = adaptive nonlocal means.
