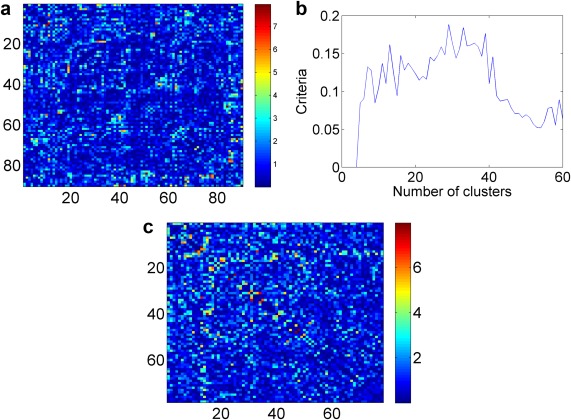
Figure 3.

(a) Heatmap of −log(p) values for all edges between TC and TSD. (b) Tuning parameter selection criteria function. (c) The resulting heatmaps: detected networks along the diagonal. [Color figure can be viewed in the online issue, which is available at http://wileyonlinelibrary.com.]
