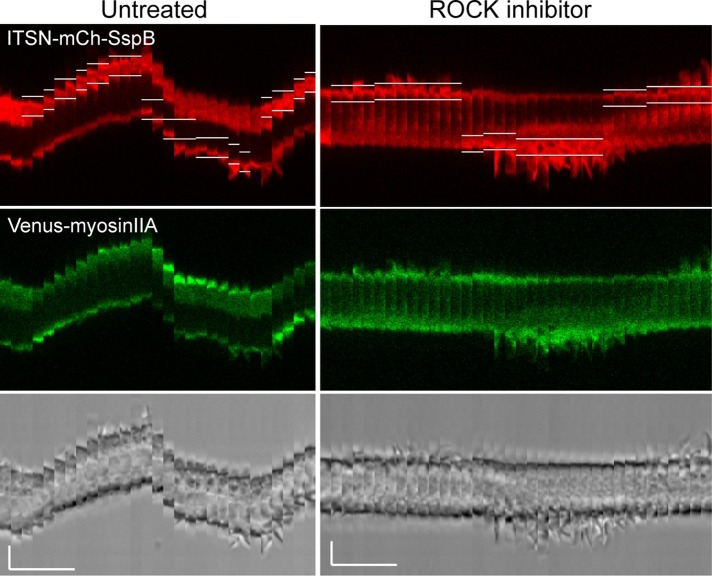
FIGURE 11:
Cdc42-mediated effects at both the front and back of a migrating cell involve ROCK. Kymographs showing a single RAW cell transfected with ITSN-mCh-SspB, iLID-CaaX, and Venus-myosinIIA. Localized photoactivation was performed before and after addition of 100 μM Y-27632 to the bath for 10 min to inhibit endogenous ROCK. The kymographs show that ROCK inhibition blocks myosin accumulation at the back and retraction of the cell rear. ROCK-inhibited cells also display more-pronounced membrane protrusions at the leading edge, but the cell fails to move forward. Similar results were observed for all cells tested (n = 7). White lines in the red images show the boundaries of the photoactivated regions. The brightness level has been increased for the red and green images on the right relative to those on the left in order to correct for some fluorescence decrease observed after addition of Y-27632. Scale bars, 5 μm (vertical), 5 min (horizontal). See also Supplemental Movie S6.

