FIGURE 5:
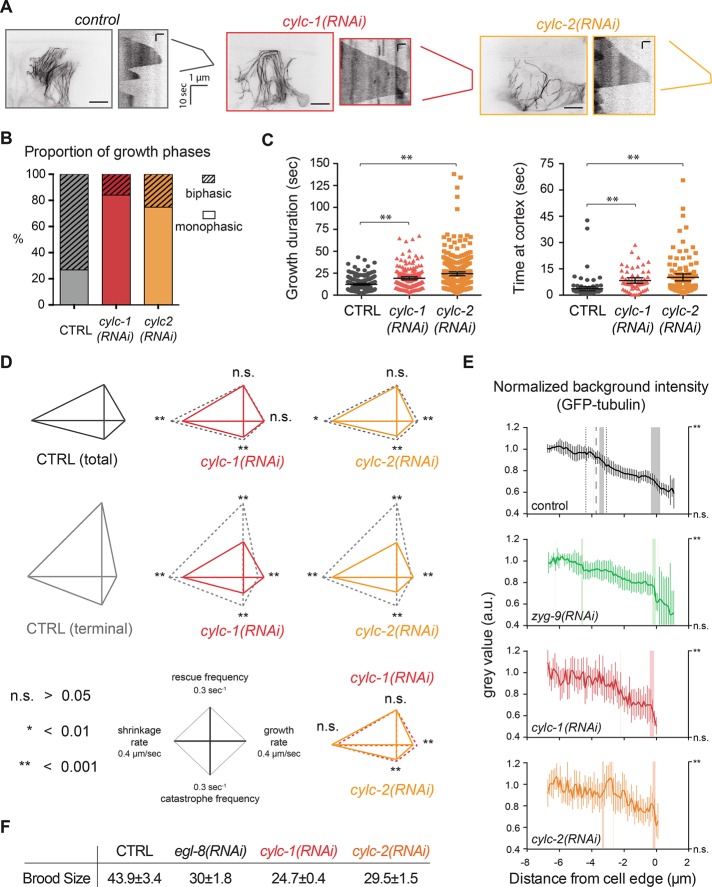
CYLC-1 and CYLC-2 abrogate MT deceleration and soluble tubulin compartmentalization in UMCs. (A) Maximal intensity projection of UMCs in adult worms after CYLC-1 or -2 depletion. Scale bar, 10 μm. Kymographs of single MTs in these cells show suppression of deceleration in CYLC-1– or -2–depleted worms. Scale bar, 10 s (vertical), 1 μm (horizontal). (B) Proportion of MTs exhibiting monophasic or biphasic growth excursions in the terminal area of UMCs in CYLC-1– or CYLC-2–depleted worms. At least six worms and at least 69 MTs. (C) Left, the time of MT growing excursion without catastrophe is increased in CYLC-1– and CYLC-2–depleted worms. Right, time at cortex represents the time spent by MTs at the cell periphery before undergoing catastrophe. **p < 0.001, unpaired t test, compared with total control MT population. (D) Diamond graphs representing dynamic parameters in control and CYLC-1– or -2–depleted worms. n.s., not significant; *p < 0.01, **p < 0.001, unpaired t test. More than 12 worms and >160 MTs. (E) As in Figure 3, background intensity was measured next to MT tracks and normalized in each condition. Vertical lines at 3.8 μm in control (black) represent average location and SD (± 0.6 μm) of the intensity drop in control cells. The vertical shaded bar indicates significant intensity increase or decrease as described in Materials and Methods. The p value is indicated on the right y-axis. **p ≤ 0.01. At least 12 worms. (F) CYLC-1 or CYLC-2 depletion affects egg-laying function, as evidenced by reduced brood size. Number of eggs laid per day and per worm in each condition correspond to the average brood size of five worms in three different experiments. EGL-8 is a phospholipase Cβ isoform involved in egg laying (Lackner et al., 1999) and served as a positive control for the experiment.

