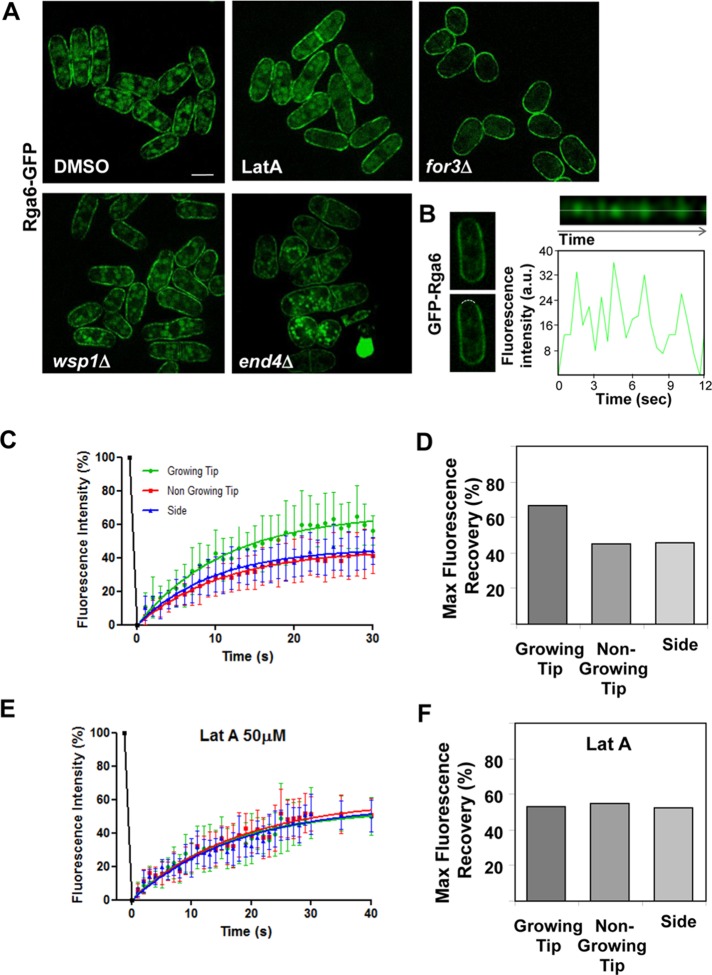
FIGURE 6:
Rga6 protein is highly dynamic, and its reduction at the growing tips is mediated by actin cables. (A) Rga6-GFP localization in wild-type cells treated with DMSO or 50 μM Lat A during 15 min, in for3Δ, wsp1Δ, and end4Δ mutant cells. Bar, 5 μm. (B) Kymograph (top) of a region (8 pixels) of the growing tip from a single cell expressing GFP-Rga6 (left) showing the fluorescence fluctuations over time. This cell was selected from the time-lapse sequence of images taken with a 0.5-s interval (Supplemental Video S1). The linescan below the image represents the total fluorescence levels along the time in the central region of the kymograph shown above (dotted line). (C) Fluorescence recovery curves of GFP-Rga6 after photobleaching of different regions (growing or nongrowing tip and side) at the plasma membrane. Best-fit curves derived from the mean intensity values of 22 cells. (D) Maximal fluorescence recovery represented as percentage of the original fluorescence from confocal FRAP measurements of GFP-Rga6 at different plasma membrane regions. (E) Fluorescence recovery curves of GFP-Rga6 treated with Lat A 50 μM for 30 min before photobleaching experiments. Best-fit curves derived from the mean intensity values of nine cells (Prism software). (F) Maximal fluorescence recovery represented as percentage of the original fluorescence from confocal FRAP measurements of GFP-Rga6 cells treated with Lat A.

