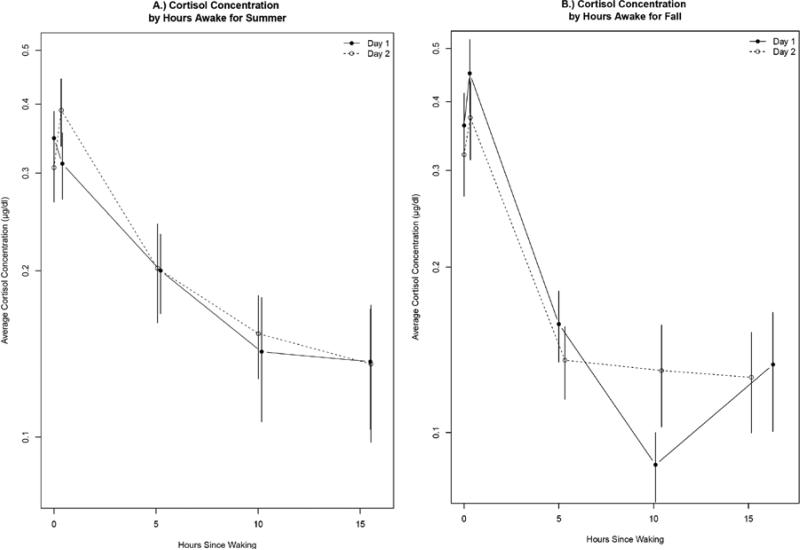
Figure 2.
Mean Salivary Cortisol concentrations by hours awake for Summer (A) and Fall (B). For both seasons, day 1 is shown by the solid line and day 2 is shown by the dashed line. Error bars are constructed using the standard error of geometric mean. For summer samples only the 30 minutes post-waking samples were significantly correlated and in the fall all samples were significantly correlated (Pearson Correlation, p<0.05).

