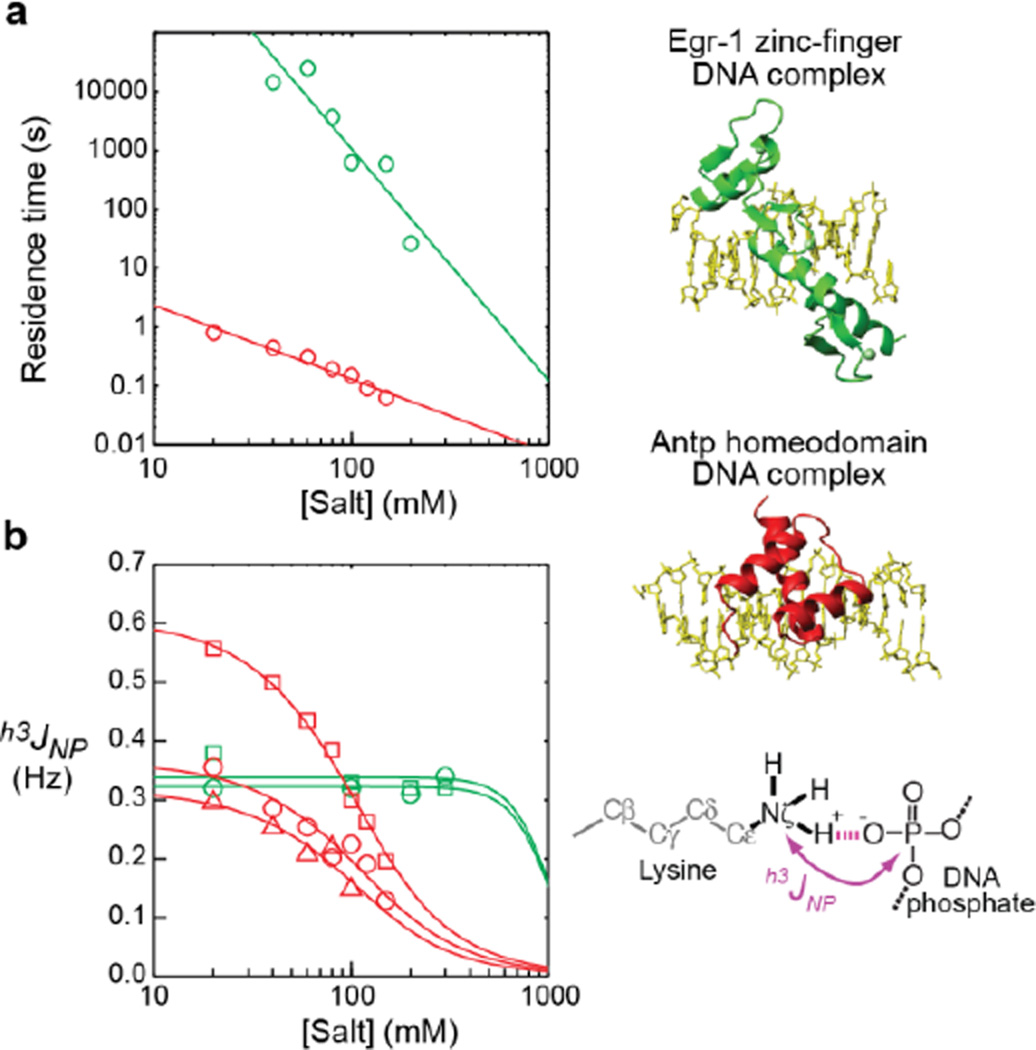
Figure 2.
Salt concentration-dependence data for the sequence-specific DNA complexes of the Antp homeodomain (C39S mutant) (red) and the Egr-1 zinc-finger (Q32E/T23K mutant) (green). (a) Residence times measured for the protein–DNA complexes. The residence times in these graphs were measured by 15Nz-exchange spectroscopy for the Antp complex and by a fluorescence anisotropy-based kinetic method for the Egr-1 complex, as described in the SI. The data are shown on logarithmic scales in both axes. (b) Intermolecular hydrogen-bond scalar coupling h3JNP between protein side-chain NH3+ and DNA phosphate groups. The red data points are Lys46 (square), Lys55 (circle), and Lys57 (triangle) of the Antp homeodomain–DNA complex. The green points are Lys23 (square) and Lys79 (circle) of the Egr-1 zinc-finger(Q32E/T23K mutant)–DNA complex. The solid curves represent the best-fit curves with Eqs. 1–6 and log τ = alog[Salt]+b. Further details of the curve-fitting calculations are included in the SI.

