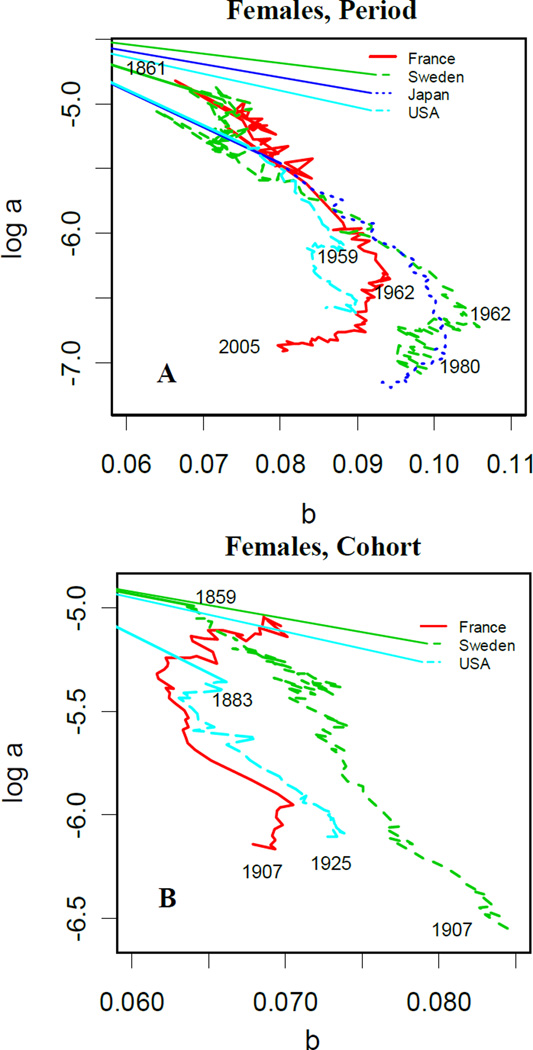
Figure 1.
(A) Female Period: patterns of SM correlation in France (1861–2005), Sweden (1861–2005), Japan (1950–2000) and the US (1938–2005); (B) Female Cohort: patterns of SM correlation in France (1859–1917), Sweden (1821–1915) and the US (1883–1927).
Note: For consistency with other studies (see Fig. 3 and Fig. 5 in Yashin et al. (2001a)), we used mortality for ages between 40 and 80.
Source: Human Mortality Database (2011).

