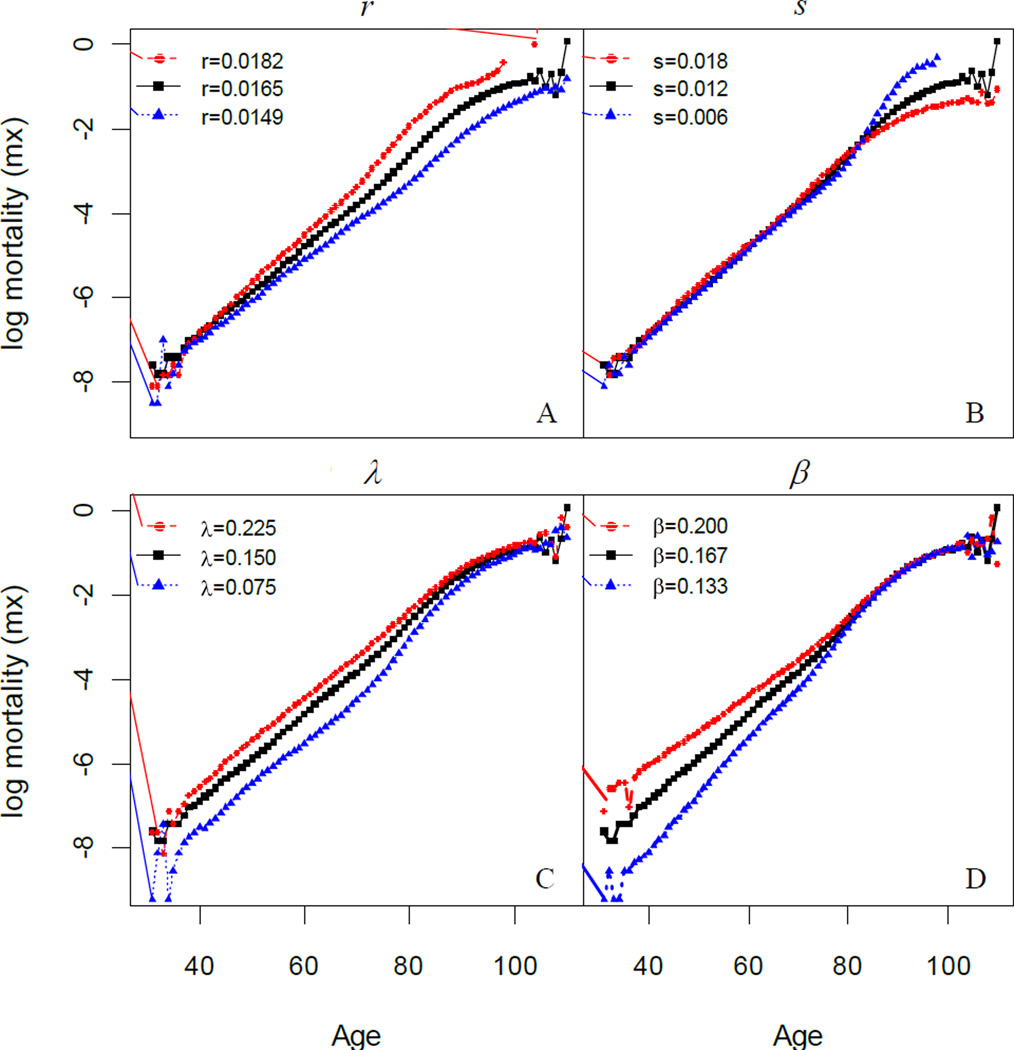
Figure 7.
Simulated patterns of log mortality under varying values of the two-process vitality model parameters. Note: (A) r changes while s, λ, and β are fixed at 0.012, 0.150 and 0.167 respectively; (B) s changes while r, λ, and β are fixed at 0.0165, 0.150 and 0.167 respectively; (C) λ changes while r, s, and β are fixed at 0.0165, 0.012 and 0.167 respectively; (D) β changes while r, s, and λ are fixed at 0.0165, 0.012 and 0.150 respectively.

