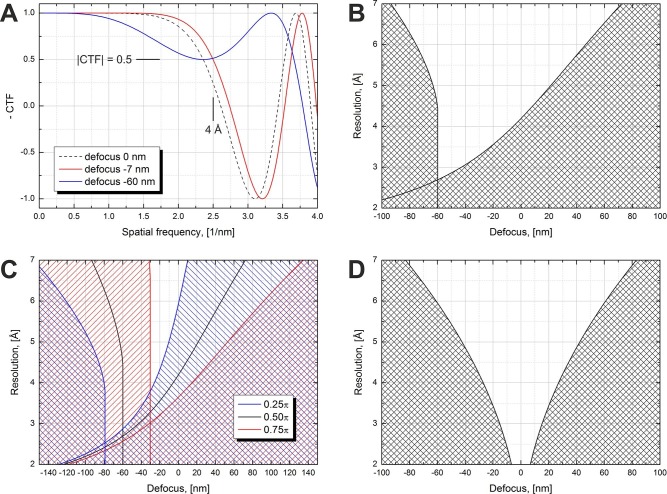
Figure 1. Volta phase plate CTF examples and allowed defocus ranges versus resolution.
(A) Illustration of CTFs at defocus values that limit the resolution to 4 Å according to a |CTF|=0.5 criterion. (B) Defocus limits versus resolution according to the |CTF|=0.5 criterion for a π/2 phase plate and 2.7 mm spherical aberration. The shaded areas are 'prohibited' in a sense that for those defocus values the CTF amplitude drops below 0.5 at a resolution lower than the value on the y-axis. (C) Same as (B) but for three different phase shift values. (D) Same as (B) but for a Cs-corrected microscope (0 mm spherical aberration).

