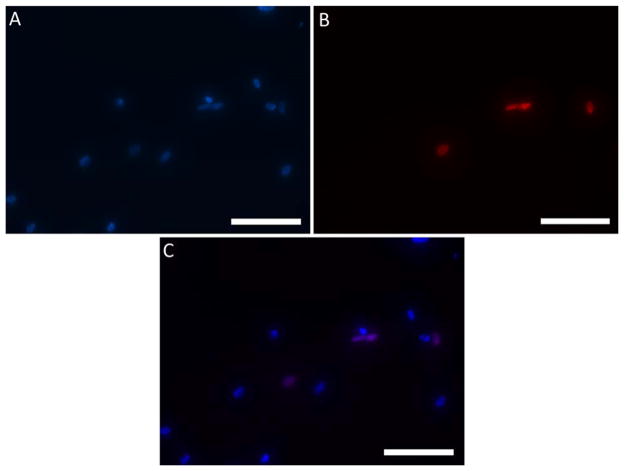
Figure 7.
Proliferation of hMSCs analyzed via Click-it™ Edu Assay and fluorescence microscopy between days 3 and 5 of cell culture. All cell nuclei are stained with DAPI (A) and proliferative cell nuclei stained with the Alexa Fluor™ 555 (B). The final panel (C) provides a merged image with the proliferative nuclei appearing purple. Maximum intensity projection of z-stacks are depicted.

