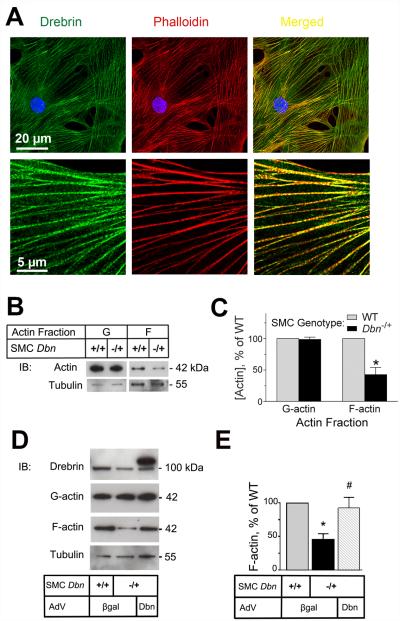
Figure 4. Drebrin stabilizes actin filaments in SMCs.
A, Primary mouse SMCs were fixed and stained with both rabbit anti-Drebrin IgG (green) and Alexa-555-phalloidin (red, for F-actin), and then imaged by confocal microscopy in the identical z-plane with post-aquisition merging of red and green channels (right). Shown are images from a single SMC, representative of hundreds of SMCs imaged in four independent staining sessions. B, Lysates from SMCs of the indicated genotypes were subjected to actin fractionation by ultracentrifugation, as in Methods. The supernatant (G-actin) and pellet (F-actin) were immunoblotted serially for β-actin and then tubulin. Shown are results from a single experiment, representative of 3 performed with independent WT and cognate Dbn−/+ SMC lines. C, Band densities for G- and F-actin were normalized to cognate tubulin band densities; within each experiment these quotients were divided by that obtained for WT SMCs, to obtain “% of WT”, plotted as means ± SE from 3 experiments. Compared with WT: *, p < 0.05. D, WT and Dbn−/+ SMCs were transduced with either control (βgal) or Drebrin-encoding (Dbn) adenovirus: subsequently actin in SMC lysates was fractionated and immunoblotted as in panel B. Shown are results from a single experiment, representative of 3 performed with independent WT and cognate Dbn−/+ SMC lines. E, Band density data for F-actin was processed as in panel C, and plotted as means ± SE from 3 experiments. Compared with WT: *, p < 0.05. Compared with cognate β-gal transduced SMCs: #, p < 0.05.

