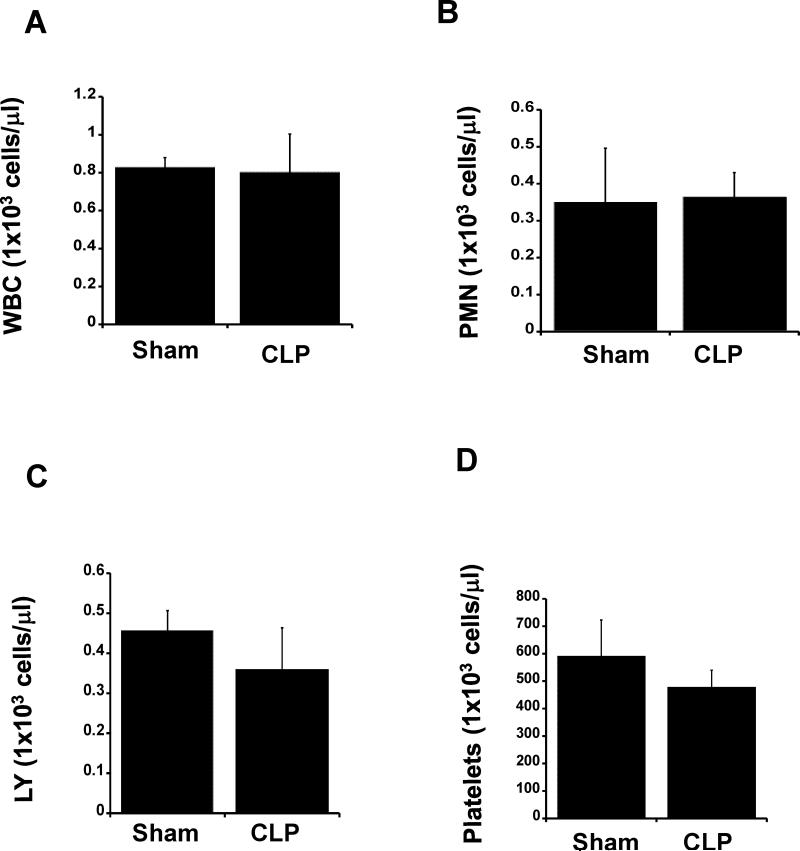
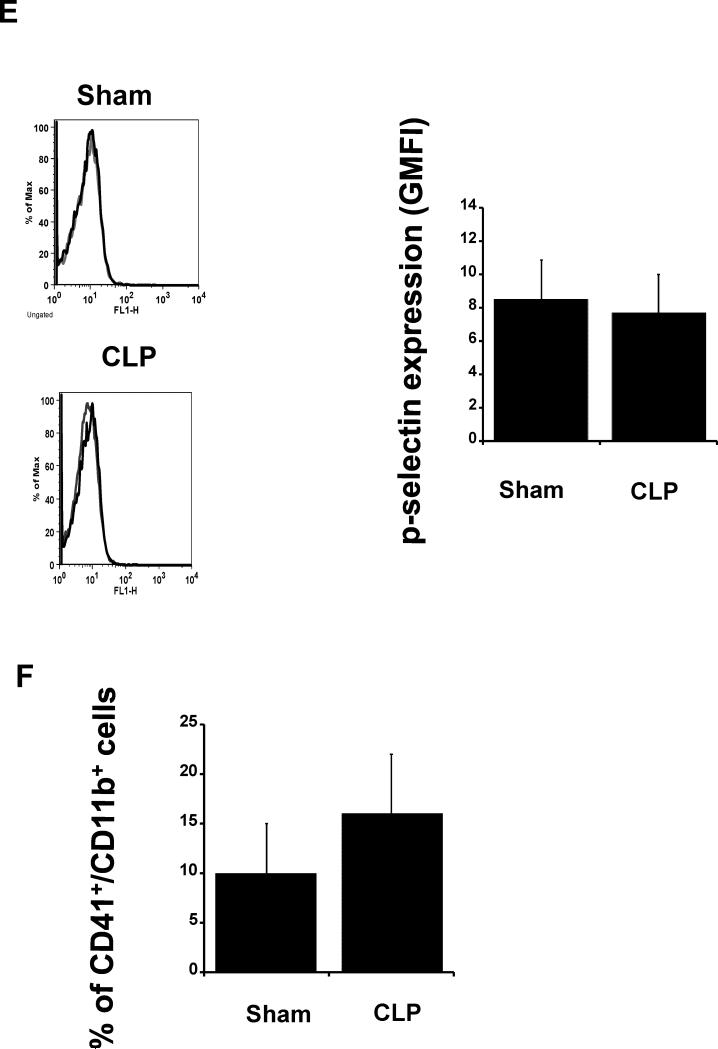
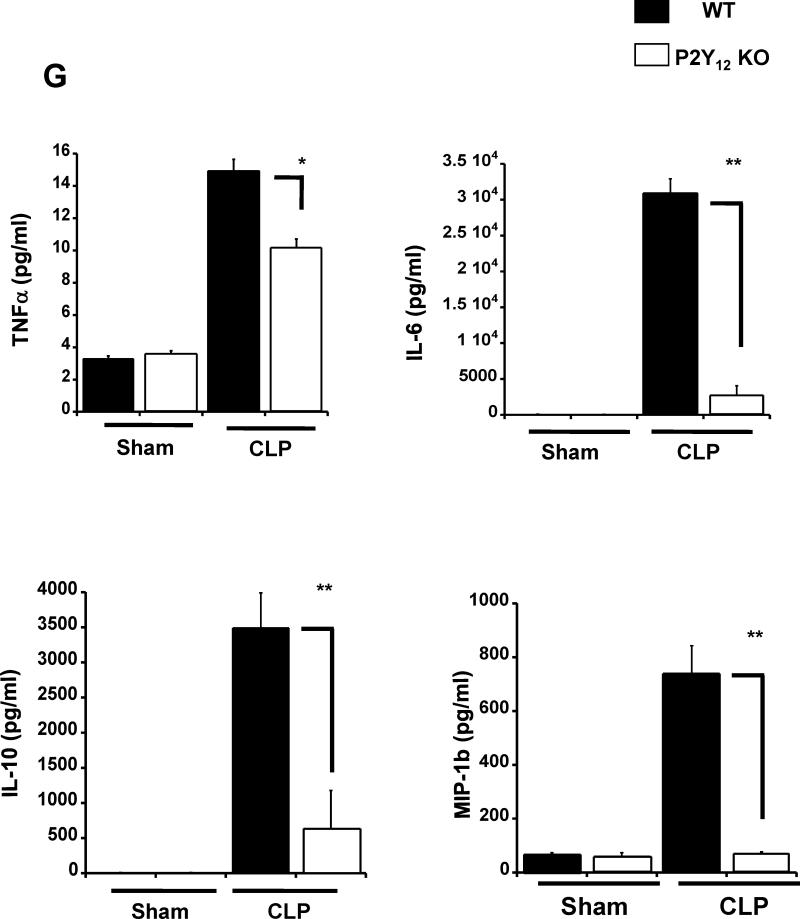
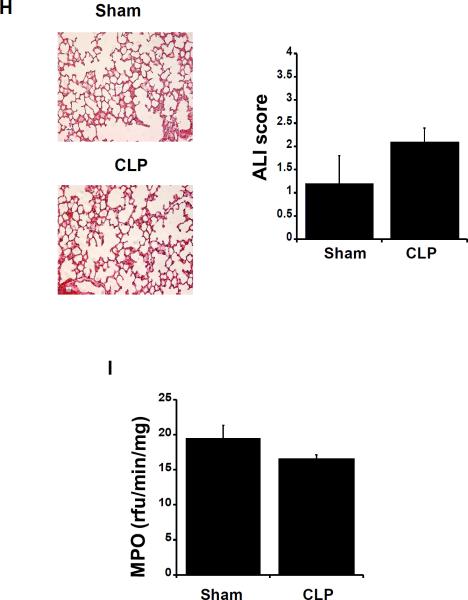
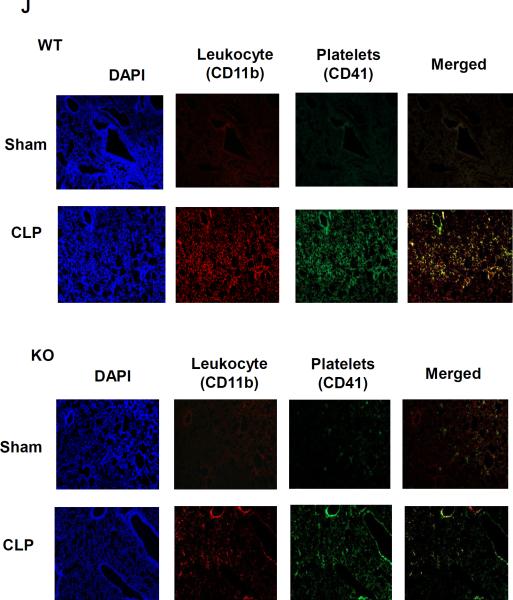
Figure 4. Circulating white blood cells counts, platelet activation, and platelet-leukocyte aggregate formation are not increased in P2Y12 null mice.
Blood samples were collected by cardiac puncture in 3.8% sodium citrate (10:1), and hematology studies performed. Graphs show counts of (A) white blood cells (WBC), (B) neutrophils (PMN), (C) lymphocytes (LY), and (D) platelets in WT P2Y12 KO mice. Both sham and CLP samples were analyzed. Values are expressed as 1×10³ cells/μL, mean ± S.E.M., (n = 8; **p<0.01 WT CLP versus KO CLP mice). (E) Blood samples were collected by cardiac puncture in 3.8% sodium citrate (10:1), and p-selectin expression on platelet surface was analyzed through flow cytometry. Representative flow cytometry histograms are shown for CLP and sham control mice. Isotype control is shown in gray and P-selectin stained samples in black. (F) The percentage of aggregates is reported for all groups. Blood samples were labelled with antibodies against CD61 (platelet marker) and CD11b (leukocyte marker). Activated leukocytes were gated based on CD11b expression, and cell shape and data were analyzed as a percentage of aggregates expressing both CD41 and CD11b. Values are expressed as percentage of CD41+/CD11b+ cells, mean ± SEM (*p < 0.05; WT sham versus WT CLP and KO CLP versus WT, n = 6). (G) Plasma samples obtained from each animal were utilized for detection levels of TNF-α, Il-10, IL-6 and MIP-1b in WT (black) and KO (white) mice. Both Sham and CLP samples were analyzed for wild type and KO animals. Values are expressed as pg/ml, mean ± S.E.M. (*p < 0.05; **p < 0.01; KO CLP model versus WT CLP, n=5). (H) Photomicrographs of hematoxylin- and eosin-stained tissue sections obtained after CLP surgery. Representative images of lung tissue specimens are shown for sham and CLP samples (Magnification 20 and 40x; n = 5). Acute lung injury (ALI) score, was assessed in KO mice. (I) MPO analysis was performed in lung samples of sham and CLP mice. Values are expressed as rfu/min/mg, mean ± SEM (n = 5). (J) Representative images of CD41 and CD11b staining (CD41: green; CD11b: red; Nucleus: blue; 20x) for CLP and sham samples for both WT and KO mice. Images are representative of 3 different experiments.

