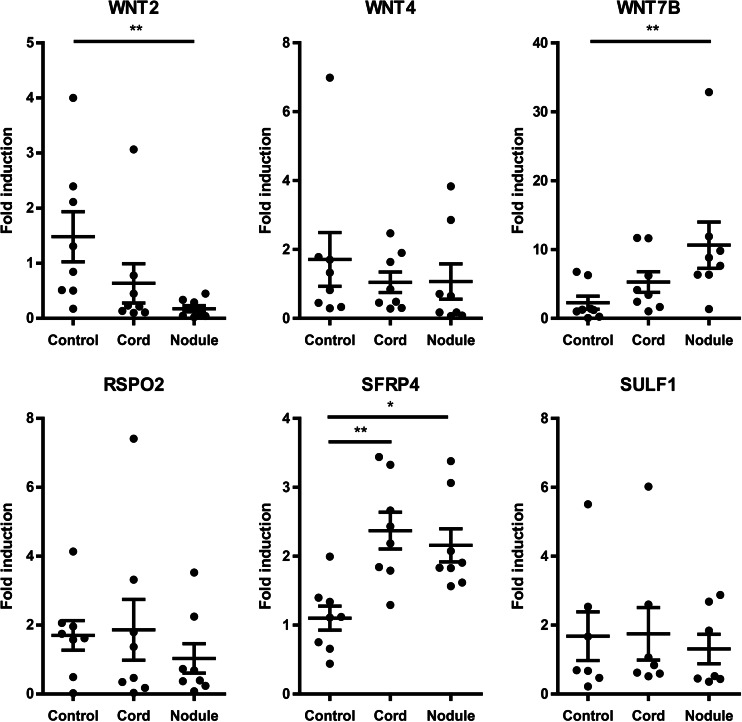
Fig. 2.
mRNA levels of WNT-related genes in Dupuytren’s disease tissue (cord, nodule) as compared to control tissue (unaffected transverse ligaments of the palmar aponeurosis). Upper panel: WNT2, WNT4, WNT7B; lower panel: RSPO2, SFRP4 and SULF1. * P < 0.05, ** P < 0.01 by Kruskal-Wallis test, followed by post-hoc Dunn’s Multiple Comparisons test

