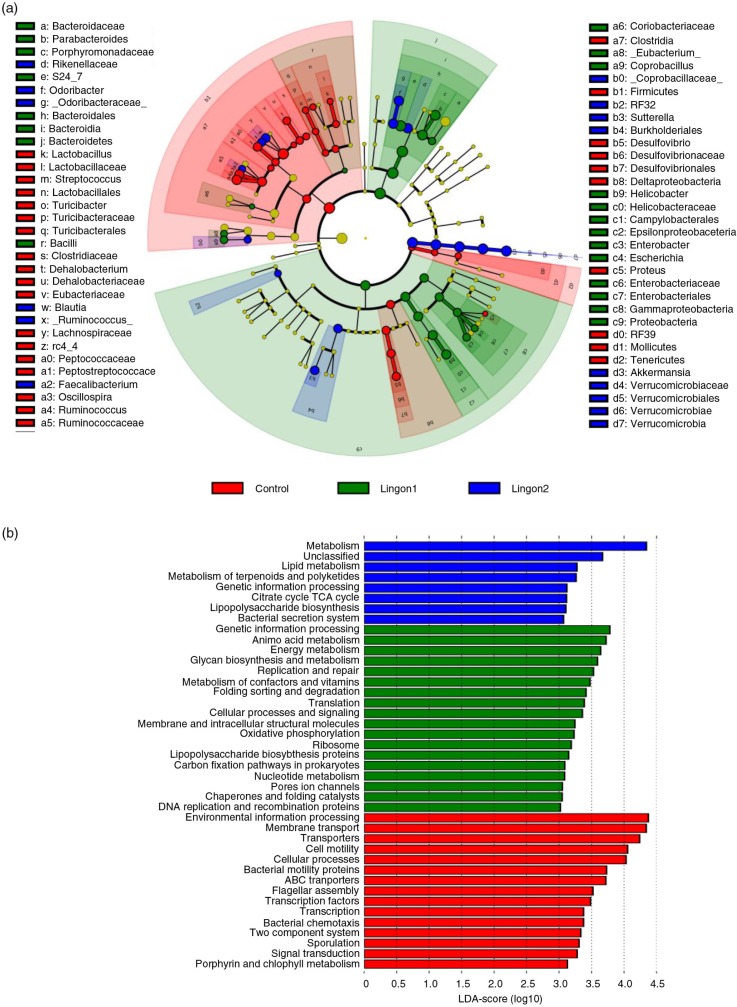
Fig. 5.
Taxonomic and functional diversity of the cecal microbiota of mice receiving high-fat diet with or without supplementation with lingonberries. (a) Significant changes in relative abundance (proportional to circle size) are marked in red (elevated in control), green (elevated in Lingon1) and blue (elevated in Lingon2). Data are derived using LEfSe and differences with a LDA score greater than 2 are considered significant, whereas non-significant changes are marked with yellow. Going towards the center of the figure, letter symbols represent phylum, class, order, family and genus, which are identified in the legend. (b) Metabolic pathways (KEGG) altered by diet were identified using PICRUSt and LEfSe (LDA>3.0). Pathways enriched in the microbiota of mice in the control group are displayed in red, Lingon1 in green and Lingon2 in blue.

