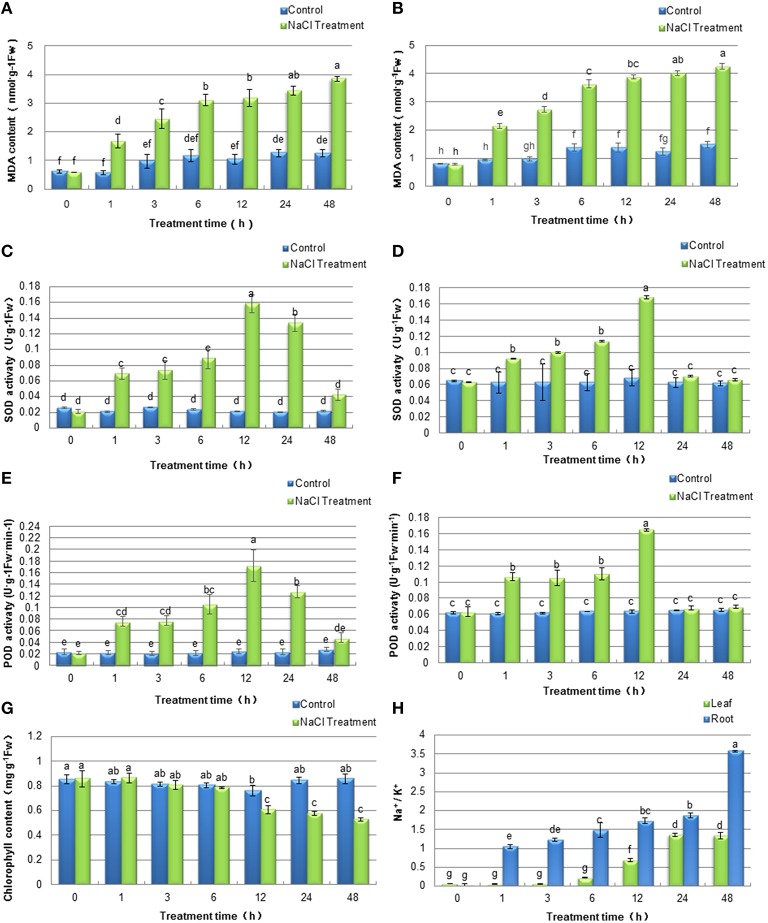
Figure 2.
Effects of salinity stress on physiological characteristics of soybean leaves and roots. Soybean seedlings were treated with 200 mM NaCl for 0 (control), 1, 3, 6, 12, 24, 48 h. The values represented the mean ± SD of three biological replicates. The different letters above columns indicated significant differences among different treatment time of soybean plants based on one-way ANOVA (p < 0.05). (A,B) MDA contents of soybean leaves and roots respectively; (C,D) SOD activities of soybean leaves and roots respectively; (E,F) POD activities of soybean leaves and roots respectively; (G) Chlorophyll content of soybean leaves; (H) Na+/K+ ratios of soybean leaves and roots.

