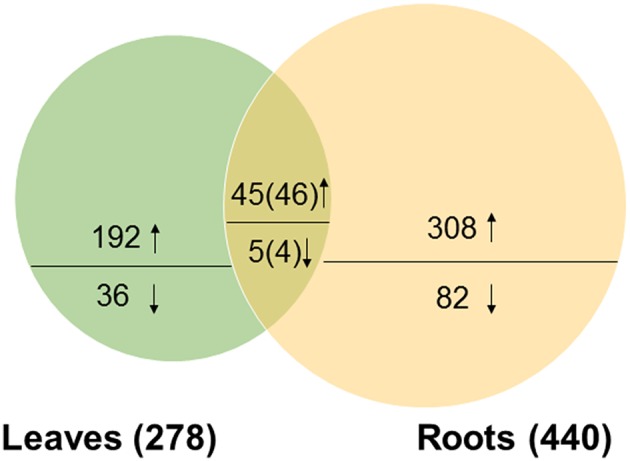
Figure 3.

Venn diagram of the distribution of differentially expressed proteins responsive to salt stress in soybean leaves and roots. The number above or below the horizontal line in each portion indicated the number of up-regulated or down-regulated proteins. The overlapping regions indicated the number of common proteins. Among the 50 common DEPs, 45 were up-regulated and 5 were down-regulated in leaves; and 46 were up-regulated and 4 were down-regulated in roots.
