Figure 3.
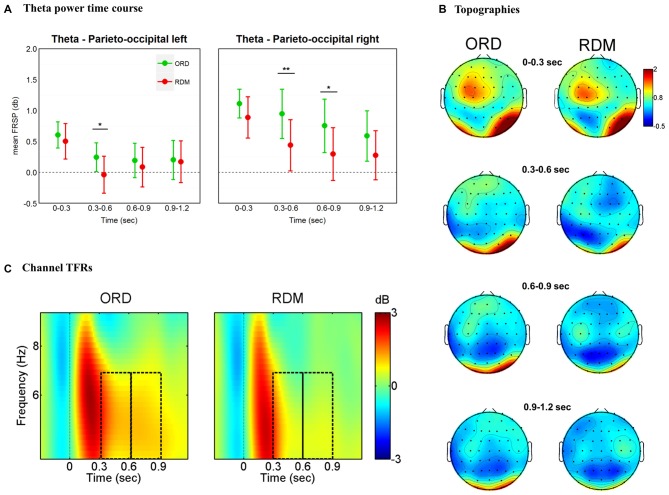
Theta band (4–7 Hz) effects time-locked to sentence onsets. (A) Time course of theta power for left and right parieto-occipital clusters. Mean power values are plotted in successive 300 ms time windows, up to 1200 ms. Error bars represent 95% confidence intervals. Significant differences between conditions are marked with asterisks: **p < 0.01; *p < 0.05. (B) Topographic maps of theta (4–7 Hz) power change in successive 300 ms time windows, up to 1200 ms. (C) TF representations of power changes at the sentence-level analysis. The black rectangles indicate the time windows (300–600 ms and 600–900ms) where theta power was larger for syntactically correct sentences compared to the condition where the order of the words was pseudo-randomized. Results are plotted for one representative channel (PO4).

