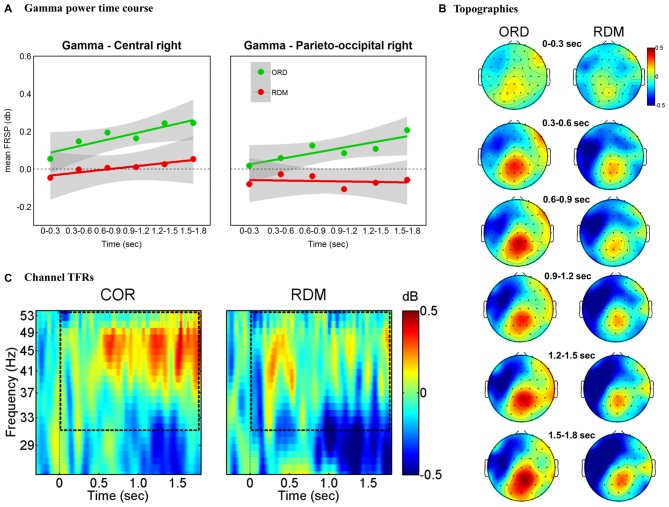
Figure 4.
Gamma band (31–55 Hz) effects time-locked to sentence onsets. (A) Time course of gamma power for right parieto-occipital and central clusters. Mean power values are plotted in successive 300 ms time windows, up to 1800 ms. We fitted a linear regression line for each condition (green and red lines). The shaded gray regions represent a pointwise 95% confidence interval. (B) Topographic maps of gamma (31–55 Hz) power change in successive 300 ms time windows, up to 1800 ms. (C) TF representations of power changes at the sentence-level analysis. The black rectangles indicate the frequency range of interest. Results are plotted at one representative channel (PO4).

