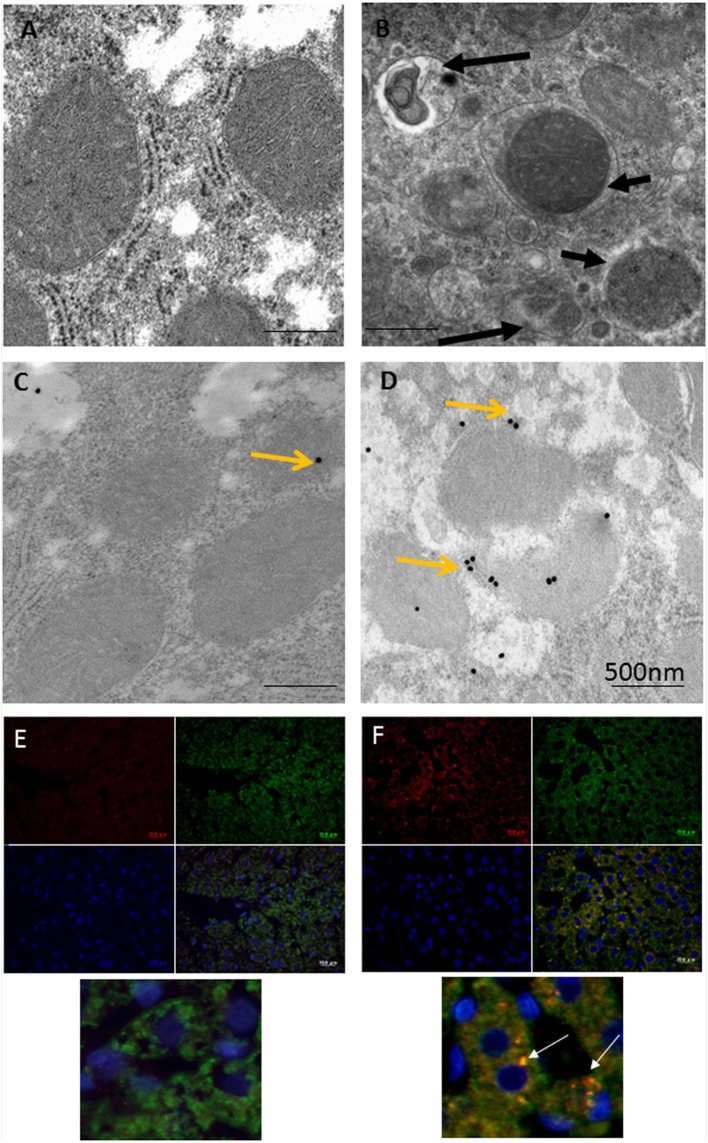
FIGURE 1.
Enhanced mitophagy in hepatocytes of ETRs. (A,B) TEM of control (A) and ETRs (B). The short black arrows indicate mitophagosomes, while the long black arrows show mitophagolysosomes. (C,D) IEM of Parkin in control (C) and ETRs (D). Yellow arrows indicate 25 nm Parkin immunogold particles. (E,F) Immunofluorescence double labeling of Parkin (Red) and cytochrome c (green) in control (E) and ETRs (F). The white arrows show colocalization signals on merging (yellow) in magnified areas below. Note that DAPI (blue) is for nuclear counterstaining.

