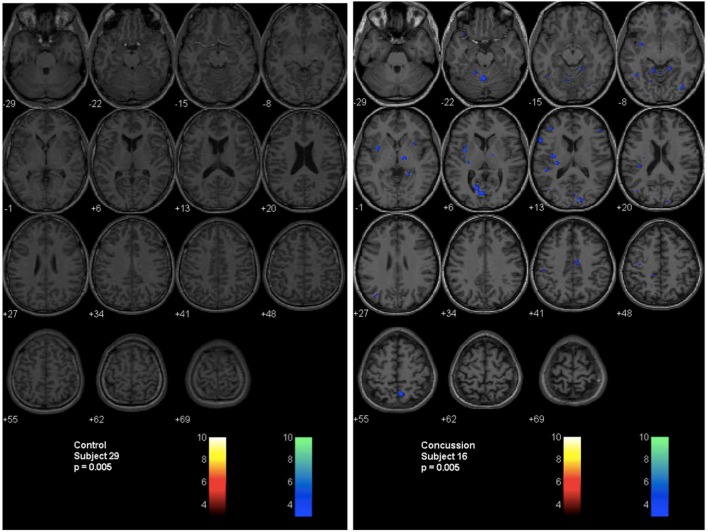
Figure 4.
Second-level analysis maps and postconcussion symptom scale scores for healthy control subject and adolescent postconcussion syndrome patient. Second level individual comparisons examined at the p = 0.005 level demonstrate no evidence of abnormal voxels in the healthy control subject compared to the atlas of normal controls (left panel). Quantitative patient-specific alterations in cerebrovascular responsiveness are demonstrated in the adolescent postconcussion syndrome patient (right panel).

