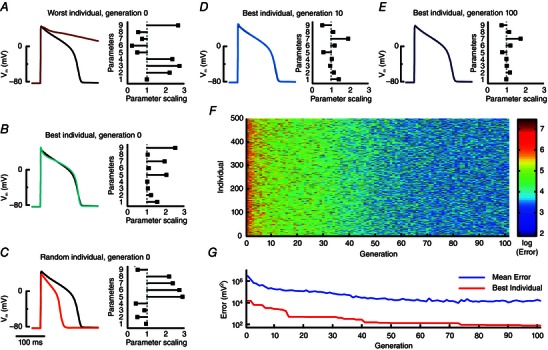
Figure 2. Progression of genetic algorithm parameter estimation .

A–C, the genetic algorithm is initialized with 500 random individuals, i.e. model instantiations, in generation 0. Models are paced and a single action potential is recorded as its phenotype. The fitness of each individual is calculated inversely as an error (sum of squared differences) between model output and target objective action potential. Left columns show action potentials generated by three different generation 0 model instantiations (traces are coloured according to their error and colour bar in F) compared to the baseline model (black). Right column bar graphs indicate the scaling of the nine model parameters for each individual, with a scaling of 1 representing the original model value. Parameters 1–9 correspond to maximal conductance of the sodium current, the L‐type calcium current, the T‐type calcium current, the inwardly rectifying potassium current, I Kr, I Ks, the plateau potassium current, the sarcolemmal calcium pump current, and the maximal flux of the sarcoplasmic reticulum Ca2+‐ATPase, respectively. D–G, with progression through the generations, individual action potentials become more similar to the optimization objective and errors decrease accordingly. At generation 100, the overall best individual and the original model are indistinguishable by eye, although the bar graph indicates differences among the parameters (E). Reprinted from Groenendaal et al. (2015).
